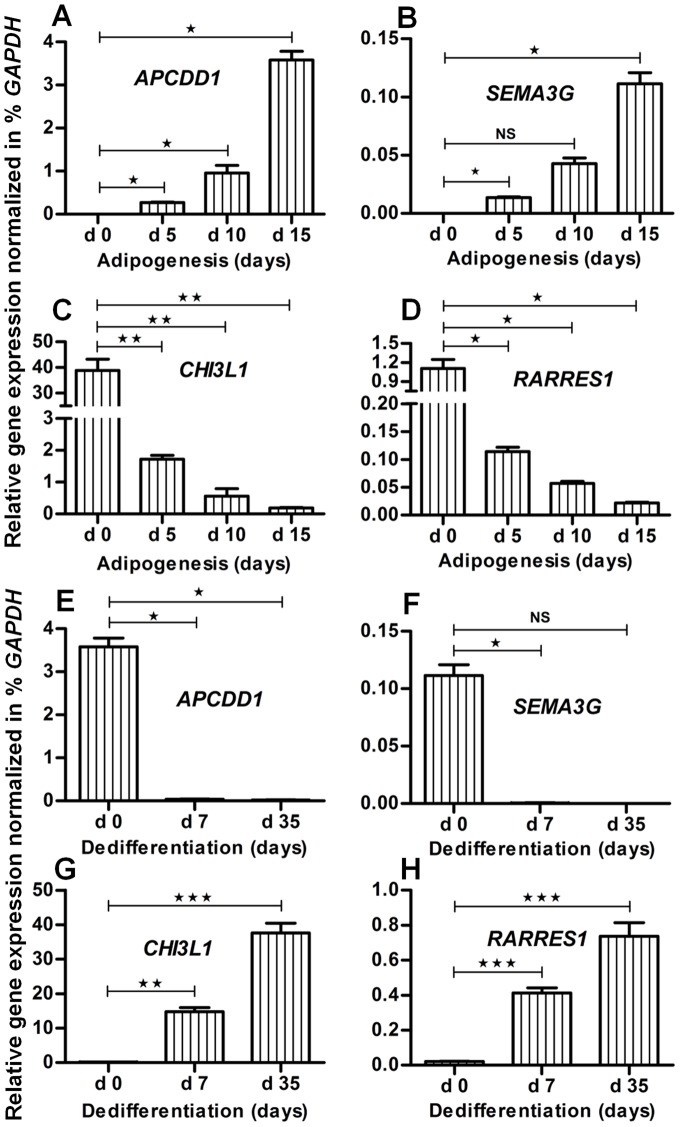
Figure 6. New potential fat marker genes, selected based on the coupling model of adipogenesis and reverse adipogenesis.
Gene expression analysis was performed using qRT-PCR and the expression values were normalized to GAPDH for stepwise assessment of adipogenesis and reverse adipogenesis (dedifferentiation). Gene expression of new potential fat marker genes (A) APCDD1, (B) SEMA3G, (C) CHI3L1 and (D) RARRES1 is given for different stages of adipogenesis, i.e. at day 5, day 10 and day 15. Similarly, the expression of (E) APCDD1, (F) SEMA3G, (G) CHI3L1 and (H) RARRES1 is given for different stages of dedifferentiation (reverse adipogenesis). Here the gene expression of adipogenic differentiated cells is represented by day 0 as a reference for dedifferentiation. Error bars, Means ± S.E.M (n = 3); *P<0.05; **P<0.01; ***P<0.001, NS, not significant (student t test, performed for statistical analysis).

