
Figure 4. Decay of linkage disequilibrium (LD) of the whole genome of Tibetan wild barleys and cultivated barleys.
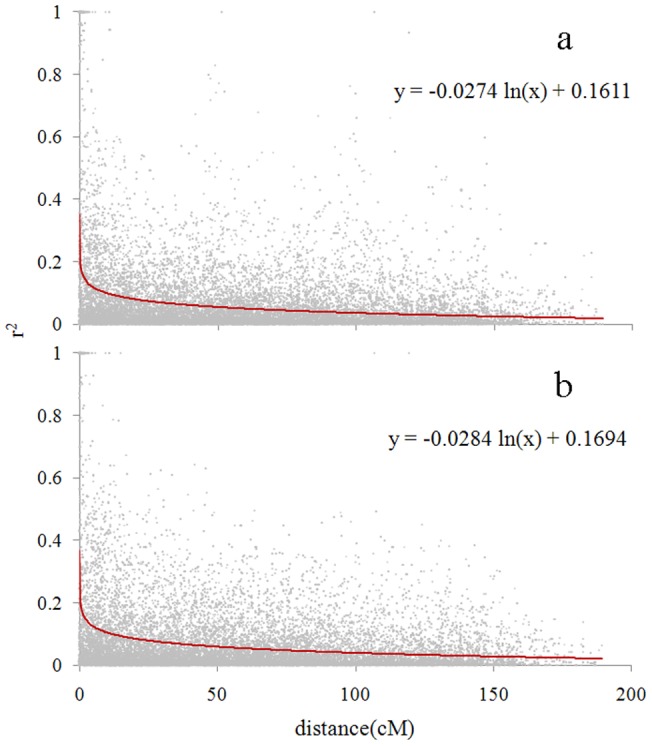
(a) LD decay in Tibetan wild barleys. (b) LD decay in cultivated barleys. The y axis r2 represents the squared allele frequency correlation coefficient between every two linear DArT markers. The decay of genetic distance is 9.30 cM (r2 = 0.1) in Tibetan wild barley and 11.52 cM in cultivated barley.