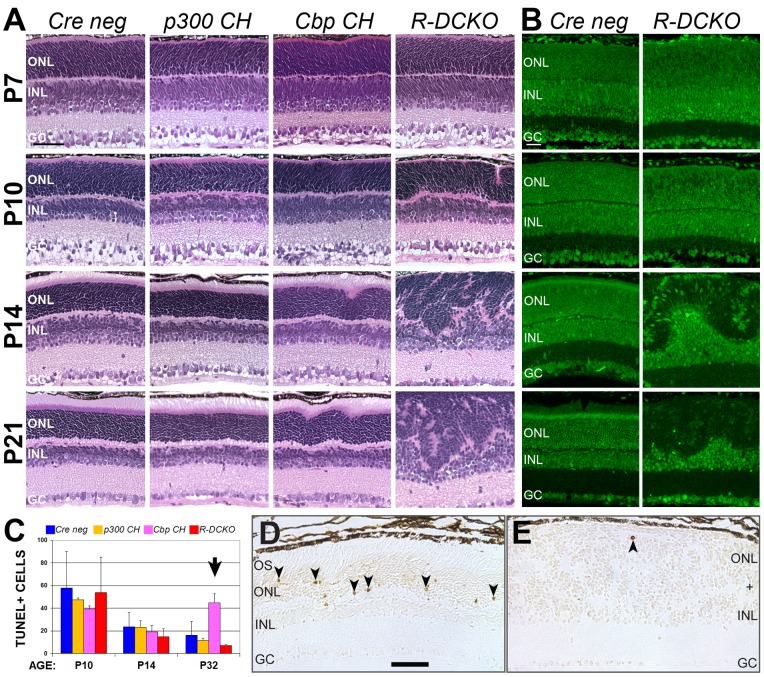
Figure 3. Development of conditional knockout phenotypes.
A. H&E-stained sagittal sections of retinas from mice representing each indicated genotype (see Table 1), at the indicated ages. Irregularities appear in the ONL of R-DCKO mice at P10, and in Cbp CH retinas at P14. Scale bar = 50 μm. B. Immunofluorescence staining for p300 (green) shows progressive loss of p300 from ONL cells of R-DCKO retinas between P7 and P14. Scale bar = 25 μm. C. TUNEL staining for cell death was performed on three retinas of each genotype at P10, P14, and P32. TUNEL positive cells were only increased relative to age-matched Cre negative controls in Cbp CH retinas at P32 (arrow). D. P32 Cbp CH retina showing TUNEL positive cells (black arrowheads). These are frequently seen near ONL irregularities. OS, outer segments. Scale bar = 50 μm. E. P32 R-DCKO retina containing one TUNEL+ cell (black arrowhead). R-DCKO retinas do not show increased cell death relative to Cre-negative littermates at any age examined.

