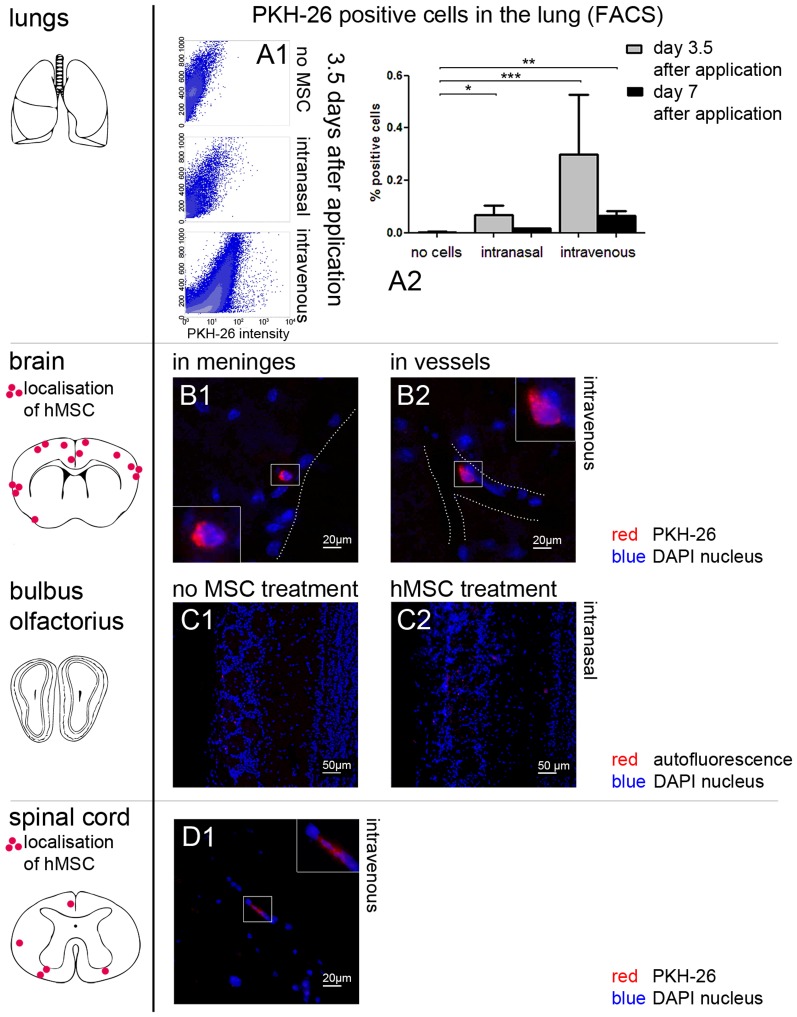
Figure 2. Cell tracking of human MSC with PKH-26.
(A1–A2) After application of human MSC red fluorescent cells were found in the lungs of treated animals in the FACS analysis. (A2) Each bar represents the mean ± SEM. Significant differences between untreated and human MSC treated groups are indicated by asterisks (*P<0.05, **P<0.01, ***P<0.001). (B1–B2) The distribution of PKH-26 positive cells after i.v. injection of human MSC shows a hematogenic pattern in the brain. Human MSC (red) can be in or near the meninges (B1, here exemplarily day 7 after application) or seem to be attached to vessel walls (B2, here exemplarily day 3.5 after application). (C1–C2) In the bulbus olfactorius no red fluorescent cells were found in animals without cell treatment (C1) or after i.n. application of human MSC (C2). Here day 3.5 after application is shown exemplarily. Only some dim autofluorescence can be seen (red). (D1) PKH-26 positive cells (red) were found in very low numbers in the spinal cord after i.v. injection of human MSC (here exemplarily day 3.5 after application). For better visibility borders of parenchyma are illustrated with a dotted line (B1, B2). Nuclei were counterstained with DAPI (blue) (B1-D1).

