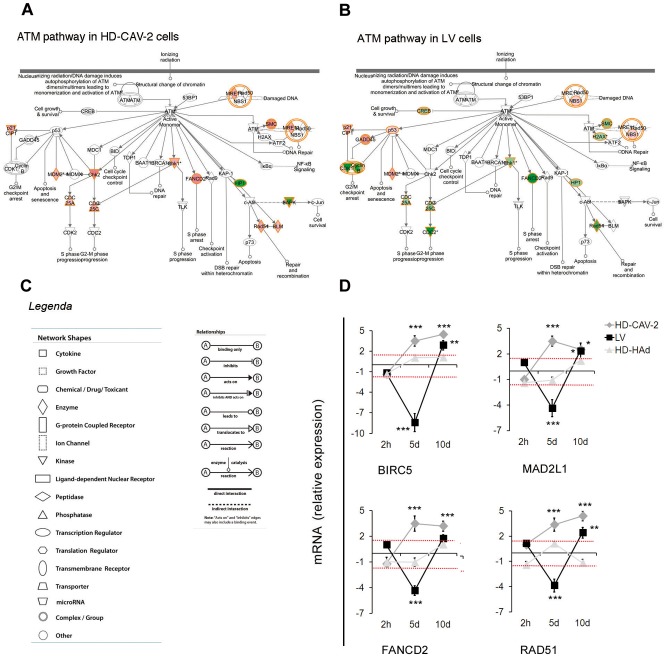
Figure 4. ATM signaling modulation by HD-CAV-2 and LV.
(a,b) ATM pathway in HD-CAV-2 (a) and LV (b) cells at 5 days posttransduction. In red are highlighted the upregulated genes, in green, the downregulated ones, in white genes not modulated in the chip; IPA p-value, HD-CAV-2 1.68×10⁻⁸, LV 5.11×10⁻¹¹. (c) The legend in the panels is valid for (a) and (b). (d) Single gene alterations were evaluated by qPCR 2 h, 5 and 10 days posttransduction. Data are presented as fold change expression of each transcript normalized with respect to the endogenous control and calculated as compared to the mock sample considered as 1. Red dashed lines display the threshold set at ±1.5, as for microarray data. Data are reported as mean of three independent experiments with SD; one-way ANOVA (vectors versus mock), * p<0.05, **p<0.01, ***p<0.001.

