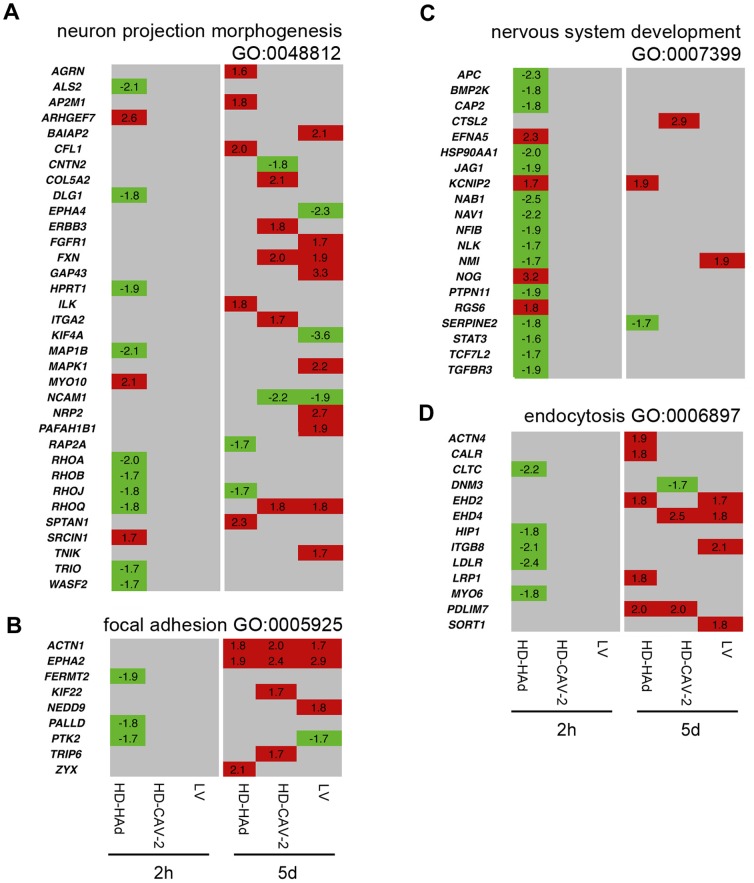
Figure 7. Comparative analysis of trafficking and neuron remodeling gene expression profiles.
(a–d) Heat maps of genes identified by combined IPA and GO analysis with a threshold set at p≤0.01, clustering in trafficking and neuron remodeling categories. The relative gene modulation change values are indicated; in red upregulated genes, in green downregulated genes, and in grey genes with unmodified expression with respect to mock treated samples.

