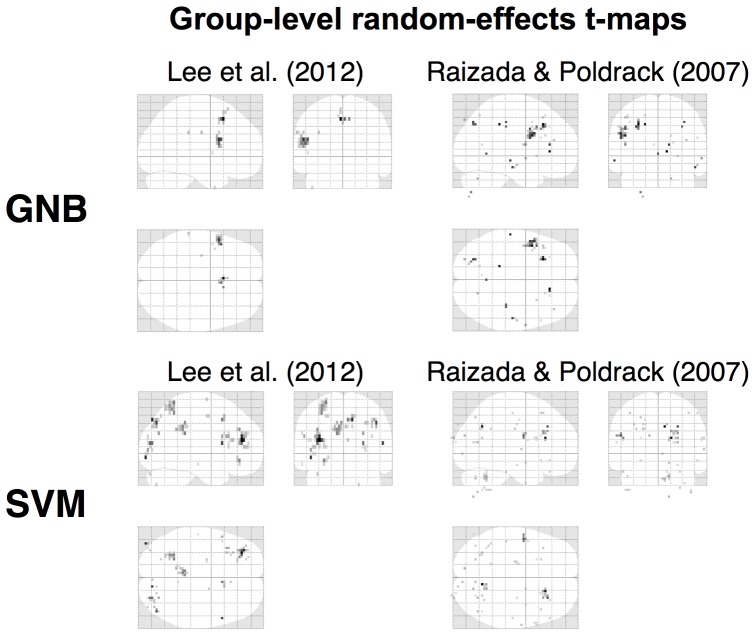
Figure 5. Comparison of GNB and SVM for group-level results.
When searchlight maps use the GNB classifier, the group level analysis shows a clear ROI in Broca's area, in the two speech data sets. In this region, the patterns of fMRI activation contain information distinguishing between /ba/ and /da/ (upper two panels). In both data sets, Broca's ROIs are statistically robust, surviving multiple comparisons correction. By contrast, the SVM classifier does not produce results which replicate across the two data sets (lower panels). Group-level random effects maps are shown at p<0.001 uncorrected without any cluster-level thresholding (k = 0).

