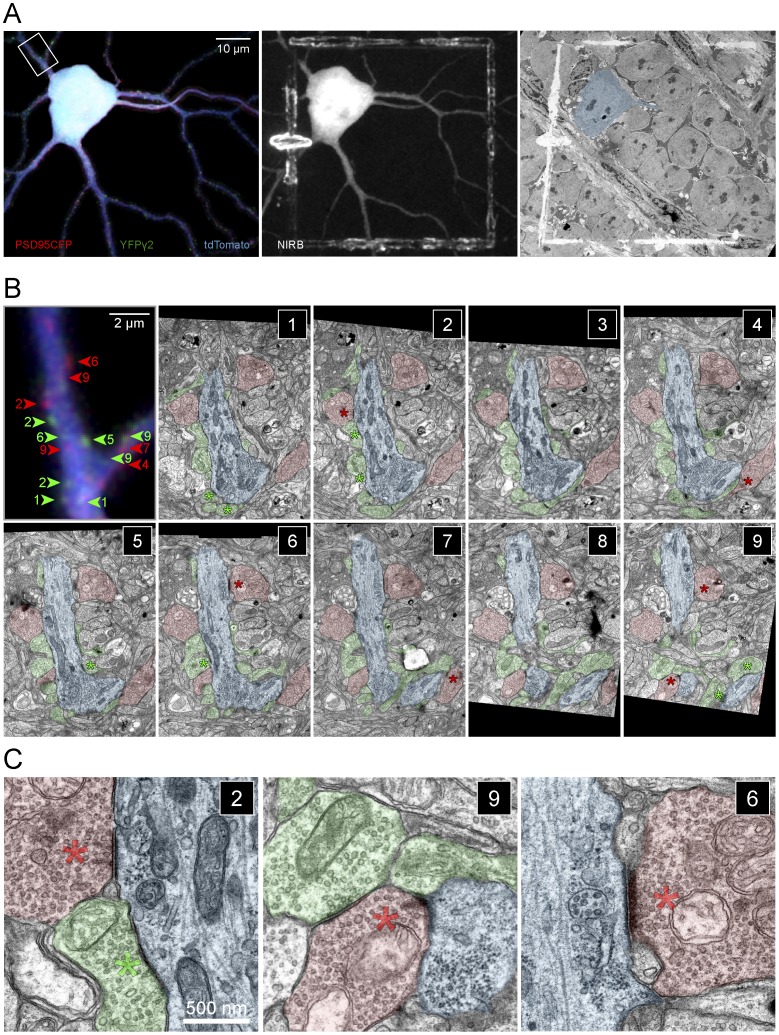
Figure 8. Correlation of fluorescent labeled GABAergic and glutamatergic postsynaptic sites with ultrastructure.
(A) (Left) MIP of an ON-S A-type RGC labeled by biolistic transfection of tdTomato and PSD95CFP in a Thy1-YFPγ2 retina. Shown here are PSD95CFP and YFPγ2 signal within the dendrites. (Middle) Image showing fiduciary marks burned at the level of the axon and cell body of the labeled RGC using the NIRBing technique [32]. (Right) EM micrograph showing the NIRBed window, allowing identification of the cell (colored blue). (B) MIP of a small section of a primary dendrite from the box in (A, left) showing YFPγ2 (green arrowheads) and PSD95CFP (red arrowheads) signal, and serial EM sections 1–9 of this region. Colored numbers in MIP indicate the serial section in which the corresponding synapse was identified (see green and red asterisks). EM sections are 80 nm thick. (C) Magnified views of bipolar (red) and amacrine (green) cell synapses on the RGC dendrite (blue) in sections (2,9,6). (Left) A cone bipolar cell terminal (red) makes a non-dyad ribbon synapse with the RGC dendrite, where two ribbons appear at the same synaptic site (red asterisk). An inhibitory amacrine cell synaptic profile can also be observed in close proximity (green asterisk). (Middle) A characteristic dyad ribbon synapse (red asterisk) between a cone bipolar cell and the RGC dendrite and an amacrine cell process (green). (Right) A contact between the ganglion cell and a bipolar cell at a plane where the postsynaptic density is evident but the ribbon is not orthogonally aligned. The synapse can be identified by examining the serial profiles in which a partial ribbon is visible (sections 4–7 in B; Movie S1).

