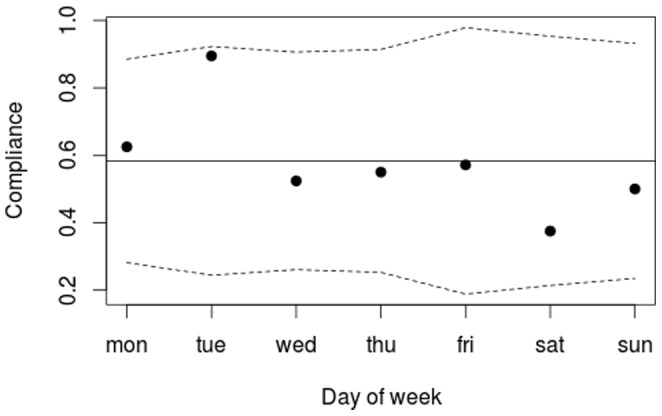
Figure 3. WOC compliance by weekday.

The proportion of patients who were observed and managed according to WOC guidelines. Each data point shows WOC compliance measured on a day of the week. Compliance is defined as the proportion of patients who had all elements of the measure completed. The dashed lines are control limits showing the range of common cause variation. The figure shows only common cause variation, i.e. there is no sign of compliance on any day of the week deviating significantly from the average.
