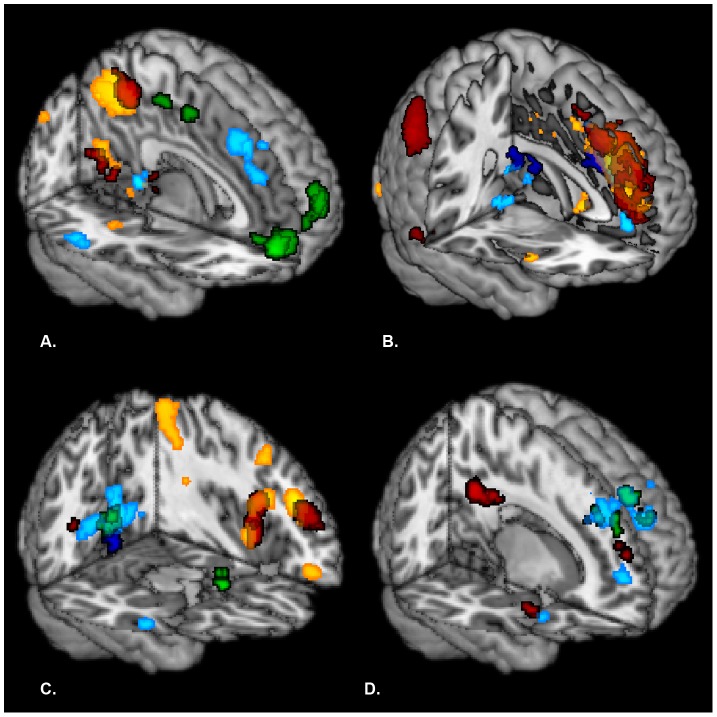
Figure 3. Functional connectivity patterns related to the thirteen seed regions overlayed on a MNI template for the different contrasts: (A) criticism > standard, (B) standard > criticism, (C) criticism > standard, positive correlation with neuroticism and (D) criticism > standard, negative correlation with neuroticism.
Brain regions, showing enhanced functional connectivity to our thirteen seed regions, are depicted in red for seed regions that belong to the prefrontal cluster, in yellow for seed regions that belong to the fronto-temporal cluster, in green for seed regions that belong to the occipito-parietal cluster and in light blue for seed regions that belong to the amygdala/hippocampal cluster. Connectivity results for the seed regions anterior cingulate cortex and SFG(BA10) are depicted in dark blue. Results were corrected on FWE cluster level (k>20) with an initial threshold of p<0.001 uncorrected.

