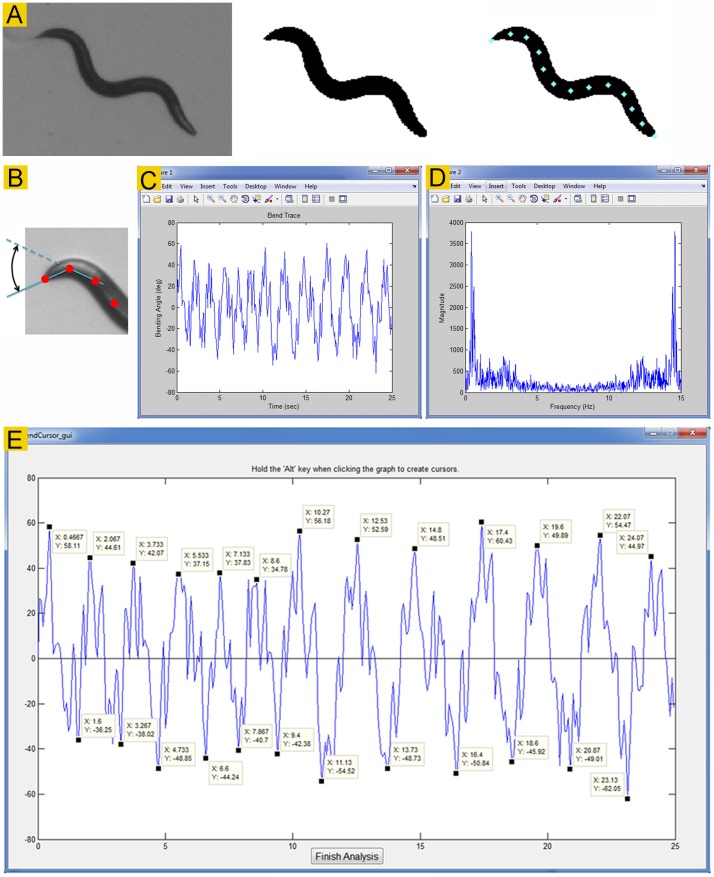
Figure 1. Image binarization and bending activity analyses.
A. Track-A-Worm converts a gray worm image (left) into a binary image (middle), identifies the head (indicated by “x”), and places 13 markers along a deduced spline at equal intervals (right). B. Diagram of the first bend, which is the complementary angle formed by the two straight lines between markers #1 (the nose) and #2, and between markers #2 and #3. C. Bend trace of the first bend of a wild-type worm. D. Bend frequency spectrum generated by Fourier transformation of the bend trace, which appears as a mirror image. The user should disregard the second half of the graph. The main peak of this graph indicates that the dominant bending frequency is ∼0.4 Hz. E. Quantification of the maximum bend from the bend trace. The bend trace shows large-amplitude bends (alternating between approximately +50 to −50 degrees) as well as many smaller oscillations. The maximum bend is the difference between the average of the most positive and negative values of the dominant bends in a bend trace.

