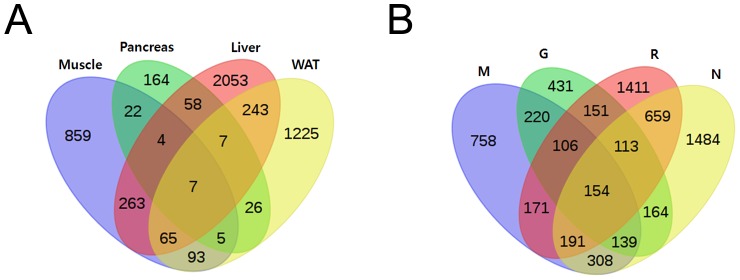
Figure 2. A Venn- diagram showing overlap of differentially expressed gene by multiple group comparison.

(A) Comparison between drug conditions with each tissue condition (B) comparison between tissue conditions with each drug condition. Significant differentially expressed genes (p value <0.01) are given for each normal ZLC group and the rosiglitazone, glimepiride, and metformin- treated groups.
