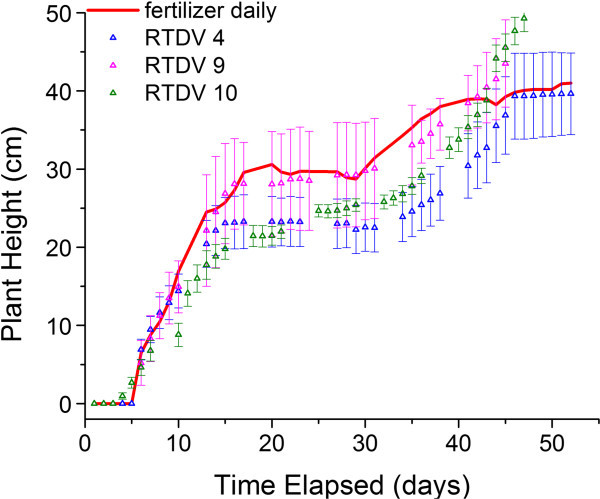
Figure 3.

The effect of loading dose and RTDV synthesis condition on the growth of wheat plants. The plants were either supplied with 20-20-20 fertilizer daily as a positive control (“red horizontal line”) or RTDVs at the start of the experiments. The RTDVs were loaded with 20-20-20 fertilizer: 22% dose, 24 h drying (“blue triangle symbol” RTDV 4), 44% dose, 24 h drying (“pink triangle symbol” RTDV 9), 44% dose, heating during cross-linking (“green triangle sysmbol” RTDV 10). Plant height (mean ± S.D., n = 3) is reported.
