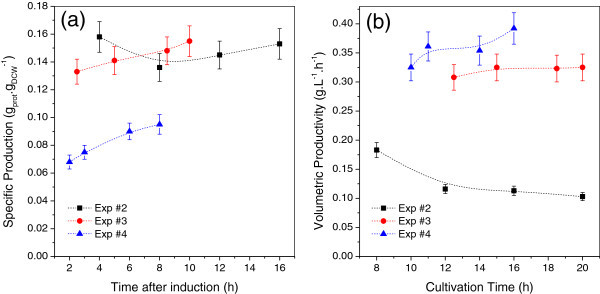
Figure 5.

Comparison of specific rSpaA production (a) and volumetric productivity (b) over time for the lactose induced protein expression. For Experiment #2, the induction was assumed to start after 4h from the onset of the experiment, which corresponds to the moment when glucose was exhausted.
