
Figure 2.
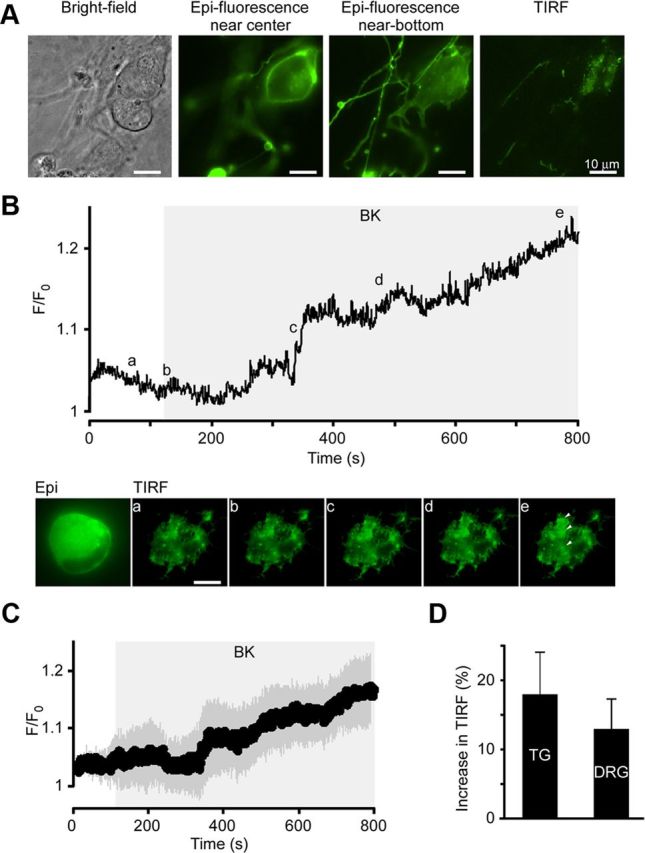
BK increases membrane TIRF intensity in sensory neurons transfected with DOR-GFP. Dissociated TG and DRG neurons were transfected with DOR-GFP and imaged using TIRF. A, Example of a typical DOR-GFP-transfected TG neuron under different illumination modes (as labeled): bright-field imaging (left), epifluorescence (middle left and middle right), and TIRF (right). In the middle right epifluorescence image, the plane of focus is closer to the coverslip. This predicts the shape of the cell “footprint.” In TIRF (right), fluorescence above the evanescent field is eliminated to reveal the actual “footprint” of the cell. B, Application of BK (200 nm) as shown by the gray area led to an increase in fluorescence in patches of membrane (e, arrows) as seen in TIRF mode. Top, Relative fluorescence of the cell footprint over time in neuron shown in the images below. Average fluorescence across the visible “footprint” was measured over time, background subtracted, and normalized to basal intensity (F/F0). Snapshot TIRF images were taken at the time points indicated by the letters. Scale bar, 10 μm. C, Mean relative intensities of the 4 of 8 neurons that responded to BK. Dark gray shading represents the SEM; light gray rectangle represents timing of the BK application. D, Average data for the maximal BK-induced increase in TIRF in TG (n = 4 of 8) and DRG (n = 4 of 7) neurons.