Figure 6.
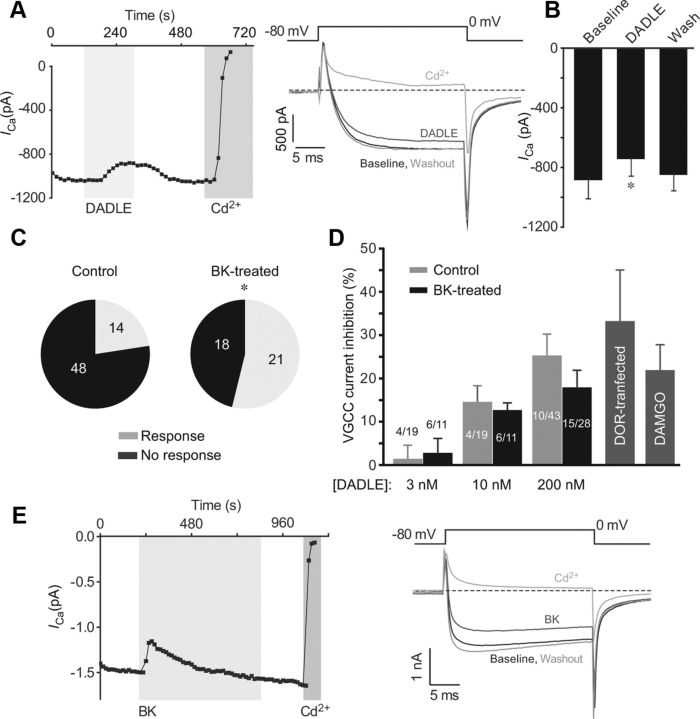
DADLE inhibition of VGCC currents in TG neurons pretreated with BK. A, Inhibition of VGCC currents by DADLE in cultured TG neurons pretreated (30 min at 37°C) with BK (200 nm). B, Bar chart represents summary data for experiments as in A for 15 of 28 DADLE-responsive, BK-pretreated TG neurons. C, Pie charts represent proportions of DADLE-responsive TG neurons in untreated control cultures (Control) and in the BK-pretreated cultures (BK-treated). *Different from control (p < 0.05, Fisher's exact test). D, Concentration dependency of inhibition of VGCC current by DADLE (3–200 nm; as indicated) in control TG neurons (light gray bars) and BK-pretreated TG neurons (black bars). Number of responsive neurons out of total neurons tested is indicated for each bar. Dark gray bars on the left represent (as labeled) the effect of 200 nm DADLE in DOR-GFP-transfected DRG neurons (DOR-transfected) and the effect of 1 μm DAMGO in control TG neurons. E, Transient inhibition of VGCC currents by BK. Recording conditions and labeling are similar to those in experiments shown in Figures 1 and 5A.

