Fig. 5.
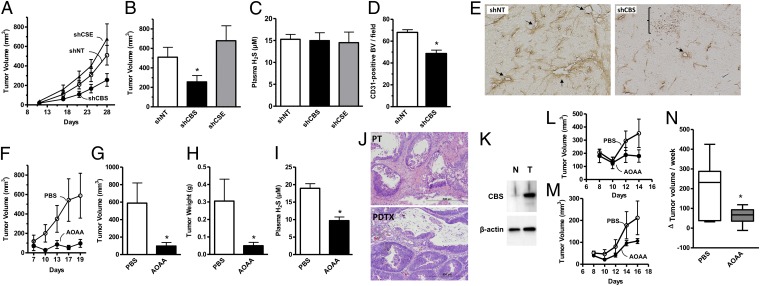
ShRNA-mediated down-regulation of CBS or pharmacological inhibition by AOAA (9 mg/kg·d−1) inhibits colon cancer growth and tumor angiogenesis in vivo. Effects of shRNA-mediated gene silencing of CBS (shCBS) and CSE (shCSE) on HCT116 tumor xenograft: (A) growth rate (shNT = nontargeting shRNA control), (B) tumor volume at harvest (*P = 0.04), and (C) plasma levels of H2S. (D) Quantification of the effects of CBS silencing on CD31-positive blood vessel density in HCT116 tumor xenografts (*P < 0.0001). (E) Photomicrographs of representative sections (10 μm) from control (shNT) and CBS knockdown (shCBS) xenografts showing CD31-positive blood vessels (brown). Note the increased density of blood vessels in shNT vs. shCBS. Arrows indicate larger vessels and bracket indicates areas of necrosis with shCBS xenograft. Effects of AOAA or vehicle (PBS) on HCT116 tumor xenografts: (F) growth rate, (G) tumor volume (*P = 0.02), (H) wet weight (*P = 0.001), and (I) plasma concentrations of H2S (*P = 0.0005). (J) Photomicrographs of H&E stained formalin-fixed paraffin-embedded sections (5 μm) of the primary colon adenocarcinoma from a patient with stage III disease and Kras mutation (PT), and the corresponding patient-derived tumor xenograft (PDTX). Note the similar morphology of both specimens. (K) Western blot comparing the relative levels of expression of CBS in tissue extracts from the patient’s tumor (T) shown in J and adjacent normal (N) mucosa. (L and M) Effects of AOAA and PBS treatment of growth rates of PDTXs from patient 1 and patient 2, respectively. (N) Summary data from two independent experiments showing the effects of AOAA and PBS on the change in PDTX volume over a 7-d course of treatment (*P = 0.07). Photomicrographs of histological sections are representative of at least n = 6 sections; tumor volume/weight data and H2S measurements represent mean ± SEM of tumors/plasma values obtained from n = 6 mice.

