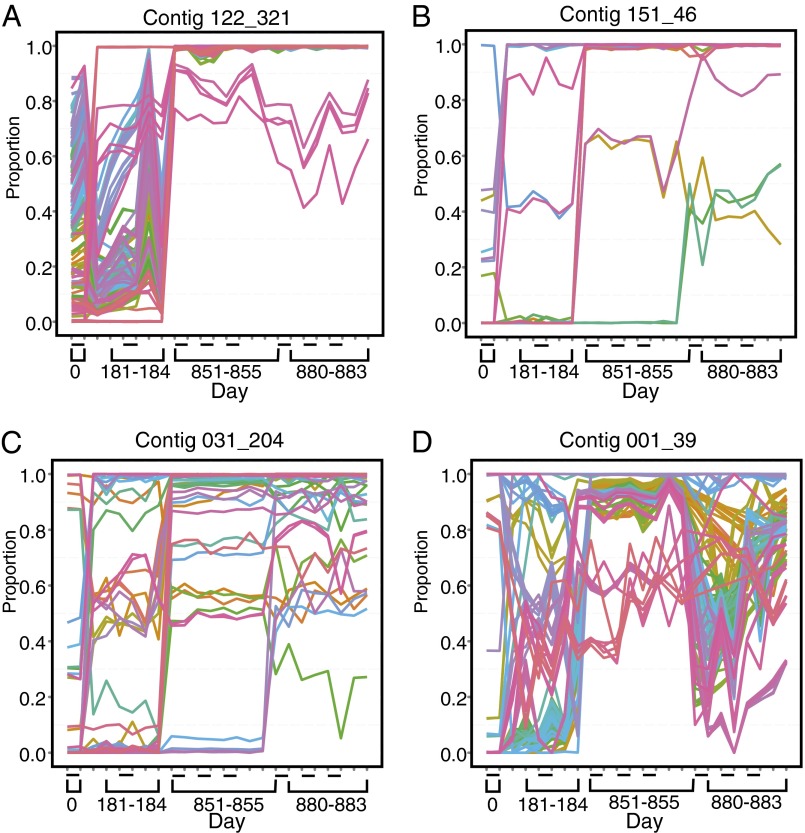
Fig. 4.
Relative abundance of SNPs in four Microviridae genomes analyzed longitudinally. Contigs studied are marked above each figure panel. The x-axis shows elapsed time since the start of the study. The y-axis shows the relative proportion of each variant in the population. The dashes on the x-axis show replicate analysis of single time points, allowing assessment of within-time point variability. Only positions with SNPs that transitioned from minor (<0.5) to major (>0.5) are plotted. The colors are used to make the different positions easier to visualize. Panel labels A–D show data for the contigs indicated at the top of each panel.

