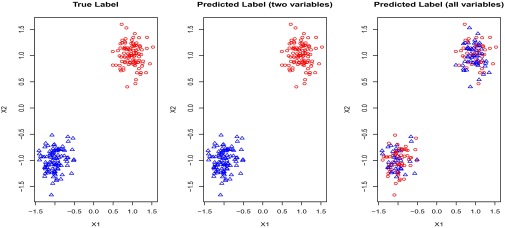
Fig. 1.

Data set contains two clusters determined by two variables  and
and  such that points around
  and
and  naturally form clusters. There are 200 observations (100 for each cluster) and 1,002 variables (
 ,
,  and 1,000 random noise variables). We plot the data in the 2D space of
  and
and  . Graphs with true cluster labels and predicted cluster labels obtained by clustering using only
  and
and  and clustering by using all variables are laid from left to right. The predicted labels are the same as the true labels only when
  and
and  are used for clustering; however, the performance is much worse when all variables are used.
