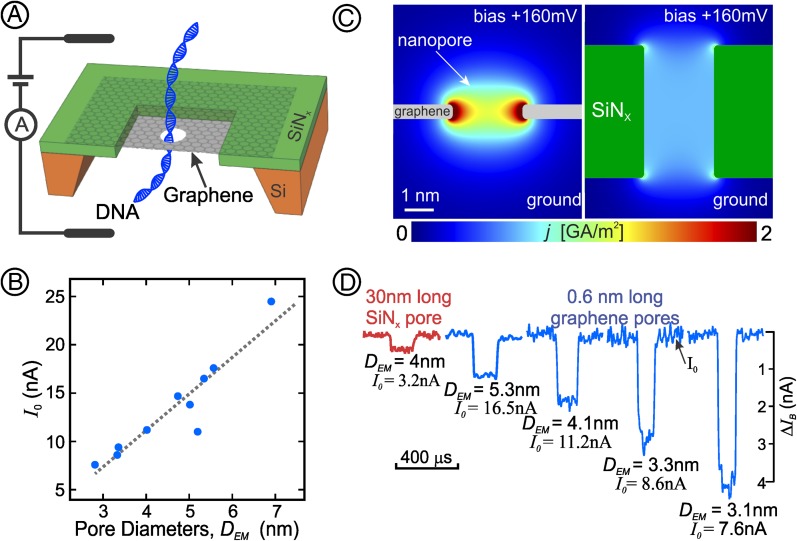
Fig. 1.
(A) The experimental device with dsDNA translocating through a nanopore in graphene mounted on a SiNx frame. (B) Open pore currents through a series of different EM-measured graphene nanopore diameters before addition of DNA. SE bars for Io are encompassed within the area of the data points; estimated errors for DEM are discussed in Materials and Methods. (C) Solution of the Laplace equation graphically displayed for the ionic current density, j (in units of A/m2), mapped through a cross-section of (Left) a short nanopore (L = 0.6 nm, D = 2.5 nm) and (Right) a longer nanopore with the same diameter (L = 5 nm, D = 2.5 nm). Note the current density is strongly localized close to the edge of the short nanopore but quite uniformly distributed throughout the entire diameter within the longer nanopore. Because of its greater electrical resistance and lesser current, nowhere in the longer nanopore will the current density reach that seen (yellow and red colors) near the perimeter of the atomically short nanopore in graphene. Scale bar and bias voltage are identical Left and Right. (D) Typical blockades as dsDNA translocates through a SiNx nanopore and through graphene nanopores of different diameters, DEM. The open pore current (Io) portion of each trace is shown on the same horizontal line even though the open pore currents varied with the pore diameters; the actual value of each pore’s Io is stated below each pore’s EM-measured diameter (DEM). All of the blockade traces are drawn to the same scale (indicated on the right).

