Fig. 2.
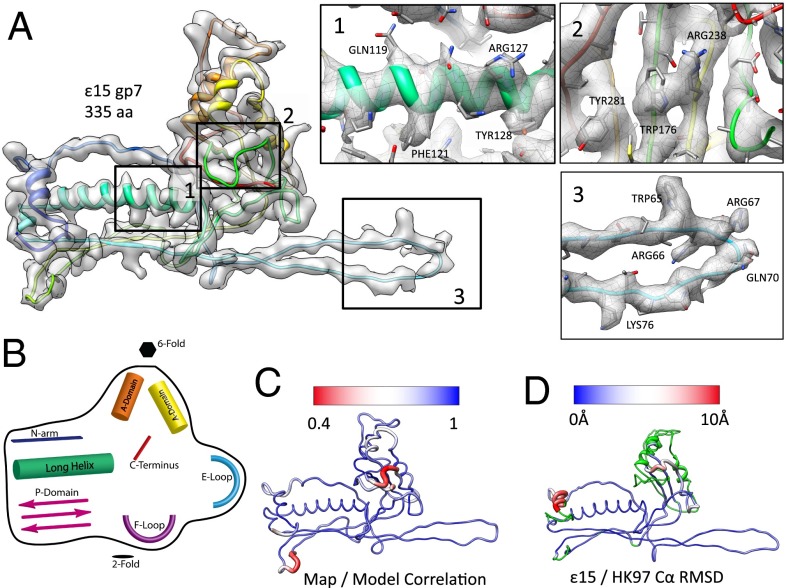
Structure of the capsid protein, gp7. (A) An averaged gp7 density map is superimposed on the gp7 (Chain C) molecular model (rainbow representation, N–C terminus). Insets (1–3) show zoomed-in views of the typical regions with the unaveraged density and corresponding model of one gp7 subunit (Chain C). (B) A cartoon diagram illustrates the structural domains of gp7 shared with other tailed dsDNA bacteriophage (Fig. S7). (C) Correlation values were computed between the map and model on a per amino acid level, then averaged for all seven subunits in the asymmetric unit. Regions shown in blue had a strong correlation between the map and model, as opposed to regions in red, which had a weak correlation between the map and model. (D) A gp7 model is colored based on the Cα rmsd between the capsid proteins from ε15 and HK97. Variations range from low to high rmsd (blue to red); green regions of the model were not used in computing the rmsd.

