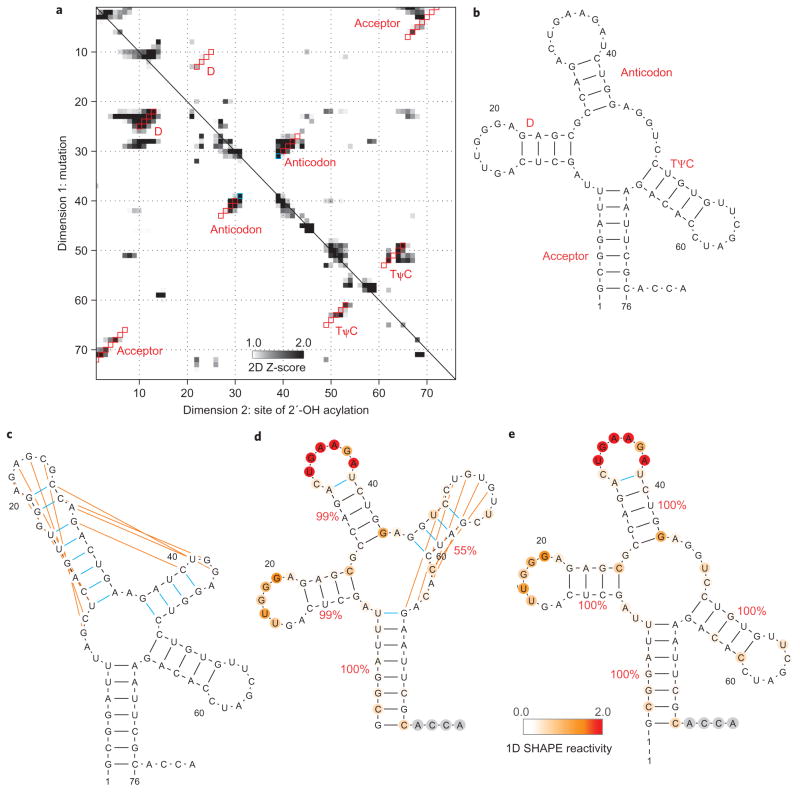
Figure 3. Comparison of chemical/computational modelling approaches on tRNAphe.
a, Mutate-and-map Z-score data for tRNAphe from E. coli. b–e, Secondary structure models of this RNA from crystallography (b), the RNAstructure algorithm without data (c), calculations guided by one-dimensional SHAPE data (d) and calculations guided by the two-dimensional mutate-and-map data (e). Red squares (a) give Watson–Crick base pairs from the mutate-and-map model that match the crystallographic secondary structure. Blue squares (a) or lines (b–e) give model Watson–Crick base pairs not present in the crystallographic secondary structure. Orange lines give crystallographic Watson–Crick base pairs missed in each model. Helix confidence estimates from bootstrapping one-dimensional (d) or two-dimensional (e) data are given as red percentage values; nucleotides are coloured according to SHAPE reactivity.

