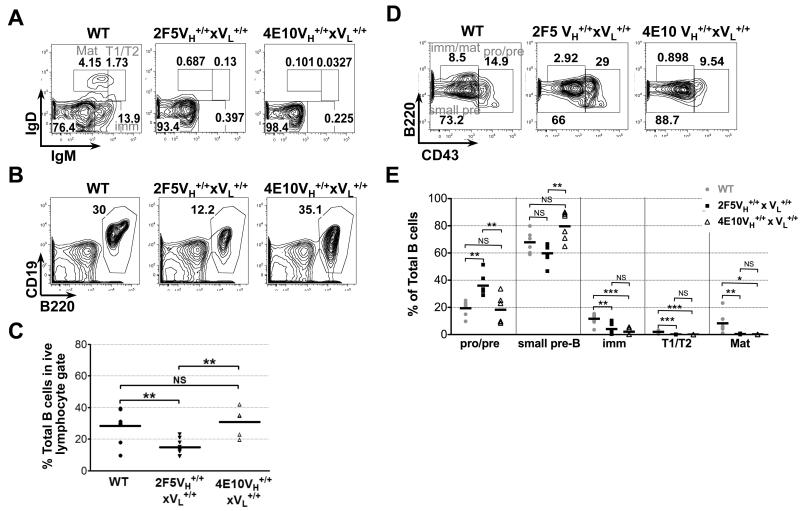
Figure 3. Flow cytometric comparison of BM B-cell development in C57BL/6 (WT), and 4E10/2F5 complete (VH+/+ × VL+/+) KI strains.
Shown are FACS contour plot histograms (representative of three experiments) indicating frequencies of either: (A) less differentiated BM B-cell subsets (fractionated/annotated as indicated in Fig. 2A), (B) total (singlet/live/lymphocyte, CD19+B220+) BM B-cells, or (D) more differentiated BM B-cell subsets (fractionated/annotated as in Fig. 2A). Also shown is statistical analysis of (C) total BM B-cell frequencies, or (E) BM B-cell subset frequencies (based on flow cytometric gating shown in Figs. 3A and D, respectively), with each closed circle, closed triangle and open square representing individual 6-12 wk female naïve C57BL/6 (WT), 2F5 complete KI, and 4E10 complete KI mouse, respectively. Horizontal lines represent averages for each group. Significance values were determined using a two-tailed student test. NS: P>0.05, *P≤0.05, **P ≤0.01, ***p ≤0.001.

