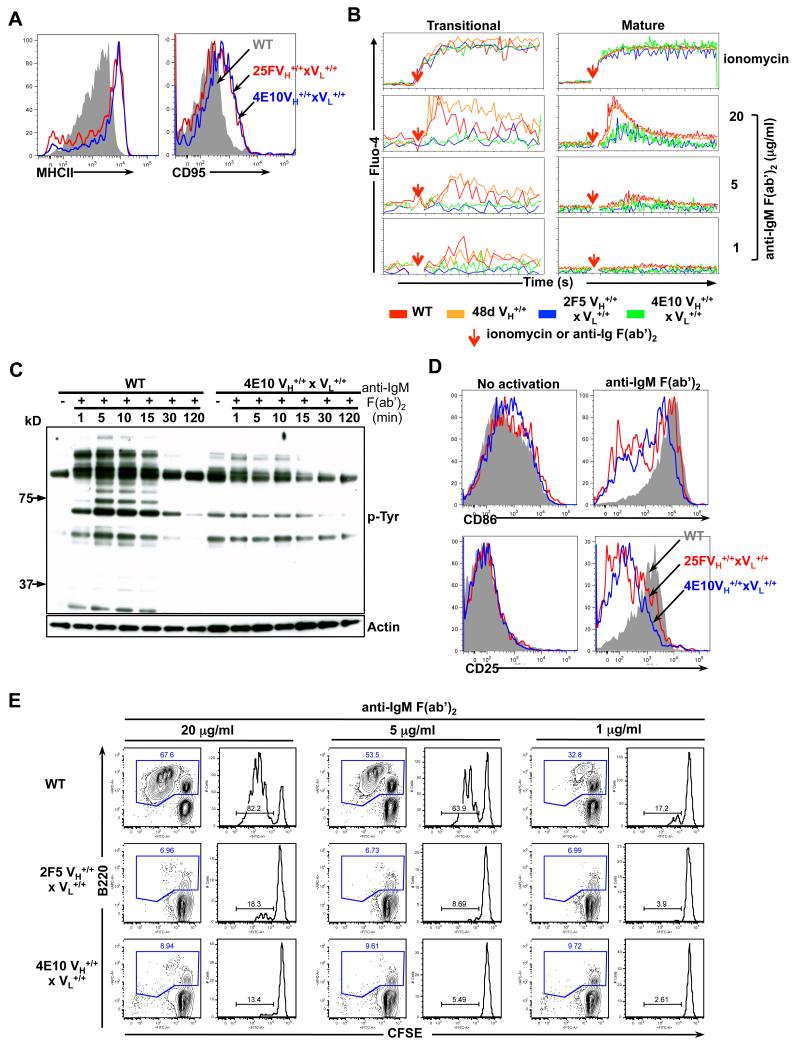
Figure 5. Phenotypic analysis of basal activation levels and functional analysis of signaling responses to in vitro BCR cross-linking in MPER bnAb KI splenic B-cells.
A. Flow cytometric analysis of surface MHC class II and CD95 expression in naïve WT and 4E10 or 2F5 complete KI B-cells, represented as grey shadow and blue or red line histograms, respectively. B. Calcium flux analysis of control WT C57BL/6 or 48d VH KI and 2F5 or 4E10 complete KI B-cells (shown in red, orange, blue and green lines, respectively). Pre-stained splenocytes from naive mice were loaded with 1μM Fluo-4, and either baseline levels of calcium, or those in response to either ionomycin (used as a positive control) or anti-IgM F(ab’)2 stimulation were added (denoted by red arrows), were detected by flow cytometry in transitional (B220+CD93+) or mature (B220+CD93−) B-cell subsets. C. Phosphorylated protein analysis of proximal signaling responses to in vitro BCR aggregation in purified WT or 4E10 complete KI splenic B cells, either incubated with medium alone (time=0) or stimulated with 20 μg/ml α-IgM F(ab’)2 for indicated times. Shown are either total phosphotyrosine protein levels, revealed by immunoblotting with the α-phosphotyrosine Ab 4G10 (upper panel) or total protein levels, revealed by re-probing the same blots with an actin-specific Ab (lower panel). (D-E). Distal signaling responses to in vitro BCR aggregation. D. Flow cytometric determination of surface expression of early/intermediate activation markers CD25 and CD86 in total naïve WT or 4E10 and 2F5 complete KI splenic B-cells (grey shadow or blue and red line histograms, respectively) either unstimulated (left panels) or in response to in vitro BCR crosslinking with 20 μg/ml α-IgM F(ab’)2 for 24h (right panels). E. Analysis of WT or 4E10 and 2F5 complete KI splenic B-cell proliferation after BCR aggregation as determined using a flow cytometric CFSE-based cell division assay. Splenocytes from naïve splenic B-cells were stimulated with 20, 5 or 1 μg/ml α-IgM F(ab’)2 with numbers in blue representing total (B220+) B-cell percentages, and those in right panels representing the percentage of dividing cells within the total (B220+) B-cell gate.

