
Figure 1.
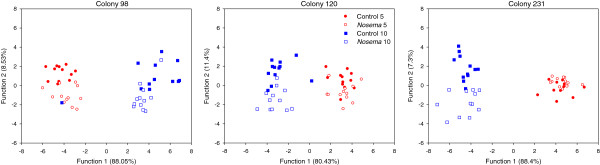
Nosema-infected bees developed different cuticular hydrocarbons profiles. Discriminant analysis based on the cuticular hydrocarbons profiles of Nosema-infected and control bees at day 5 and 10. The analysis was repeated on bees from 3 different colonies (N = 11–12 bees/colony and treatment). Young (5 days) parasitized and control bees did not display different chemical profiles, but 5 days later both profiles were distinct (see Table 2).