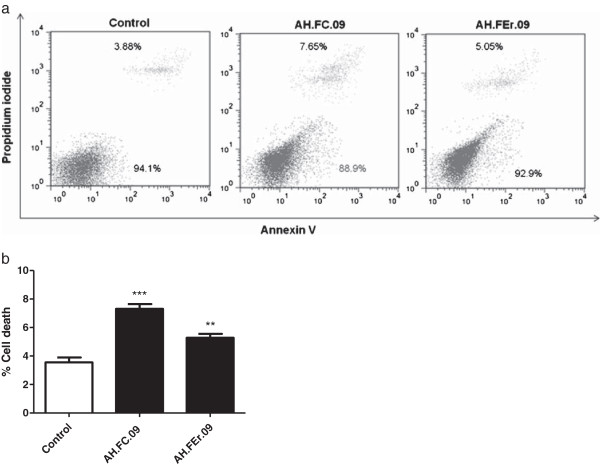
Figure 4.
Effect of propolis on HCT-15 cell death. Representative dotplot of cell population distribution stained for Annexin V and PI (a) and graphic representation (b). Cells were treated with IC50 concentrations for 24 hours and control was treated with DMSO alone. Results are presented as percentage of cell death. ** p < 0.01 vs control. *** p < 0.001 vs control.

