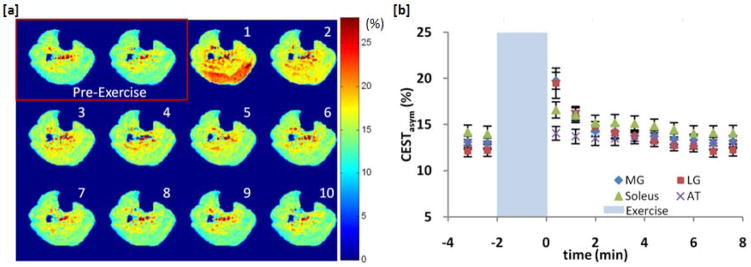
Figure 2.

Plantar flexion exercise data for subject 1. (a) CrCESTasym maps of a human calf muscle before and every 48 seconds after (in order by number) 2 minutes of plantar flexion exercise. Color bar represents CrCESTasym in percent. (b) Plot of the average CrCESTasym as function of time in 4 different muscles of the calf segmented from anatomical images. Error bars represent the standard deviation in the CrCESTasym in each region.
