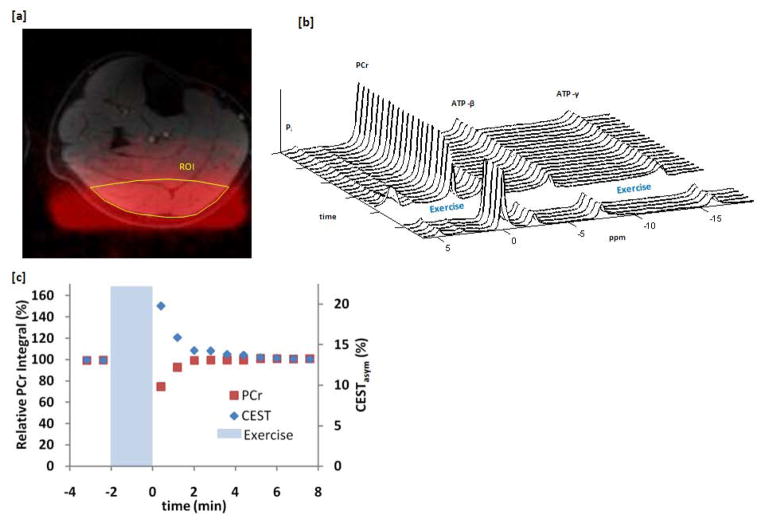
Figure 4.
31P MRS data of the healthy human calf muscle before and after exercise. (a) Excitation profile of the 31P surface coil (red) overlaid on an anatomical image of the lower leg with corresponding segmented CrCEST region of interest outlined in yellow. (b) Stacked plot of every alternate 31P MRS spectra acquired 2 minutes before and 8 minutes after exercise. (c) Comparison between the CrCESTasym and 31P MRS signal as a function of time at an equal temporal resolution of 48 seconds.

