
Figure 5.
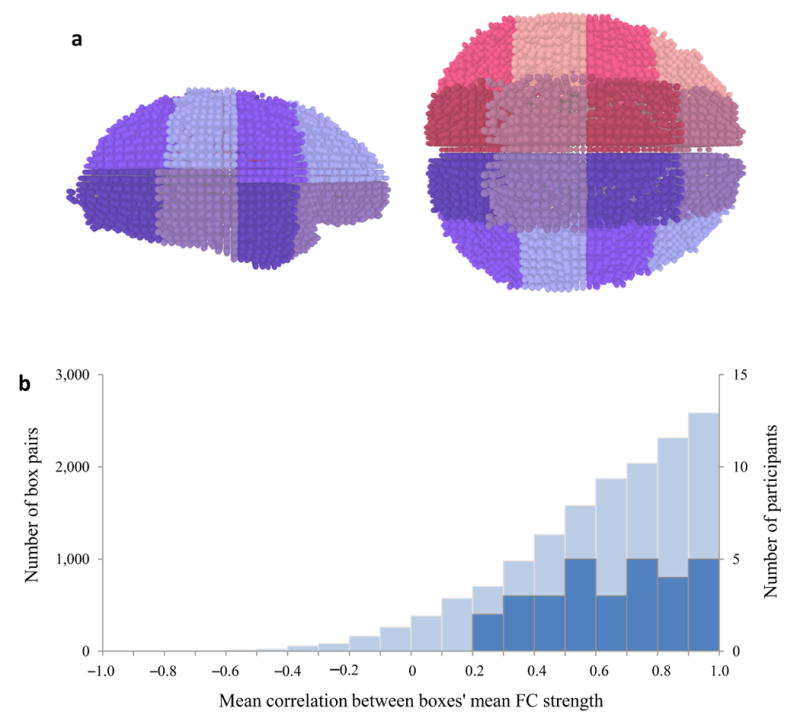
Global fluctuations in local functional connectivity. (a) 3D rendering of one participant’s gray-matter voxels divided into 32 boxes, viewed from the right and from above. Each sphere represents a voxel. Adjacent boxes are denoted in different colors. Voxel division is visualized using custom-made software created in the Processing programming environment1. (b) Histogram of between-box correlations of mean within-box functional connectivity strength (light blue, left Y axis), and of participants’ mean correlation values (dark blue, right Y axis).