
Figure 6.
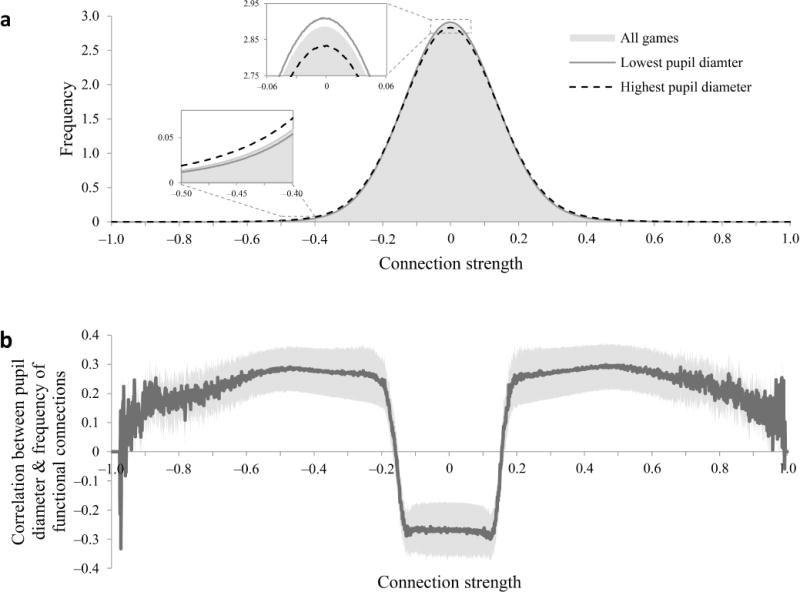
Pupil diameter and whole-brain functional connectivity. (a) Distribution of functional connections by connection strength (n = 28). The distribution is shown separately for all games (gray shading), for the third of each participant’s games in which the participant’s baseline pupil diameter was lowest (solid line), and for the third of games in which pupil diameter was highest (dashed line). Insets: magnification of boxed areas to show differences between lowest and highest pupil diameter games. (b) Game-by-game correlation between baseline pupil diameter and frequency of functional connectivity measurements as a function of functional connectivity value (n = 28). The Y axis indicates whether large pupil diameter was associated with more (positive values) or fewer (negative values) voxel pairs for which functional connectivity strength is indicated on the X axis. For each participant, we computed the distribution of functional connections during each game, and then computed the correlation across games between baseline pupil diameter and the number of voxel pairs in each bin of the distribution. The curve shows the correlations averaged over participants with s.e.m. indicated by the lighter shading. Larger pupil diameter was associated with more strong functional connectivity measurements (absolute strength > 0.17) and fewer weak functional connectivity measurements (between −0.17 and +0.17).