
Figure 7.
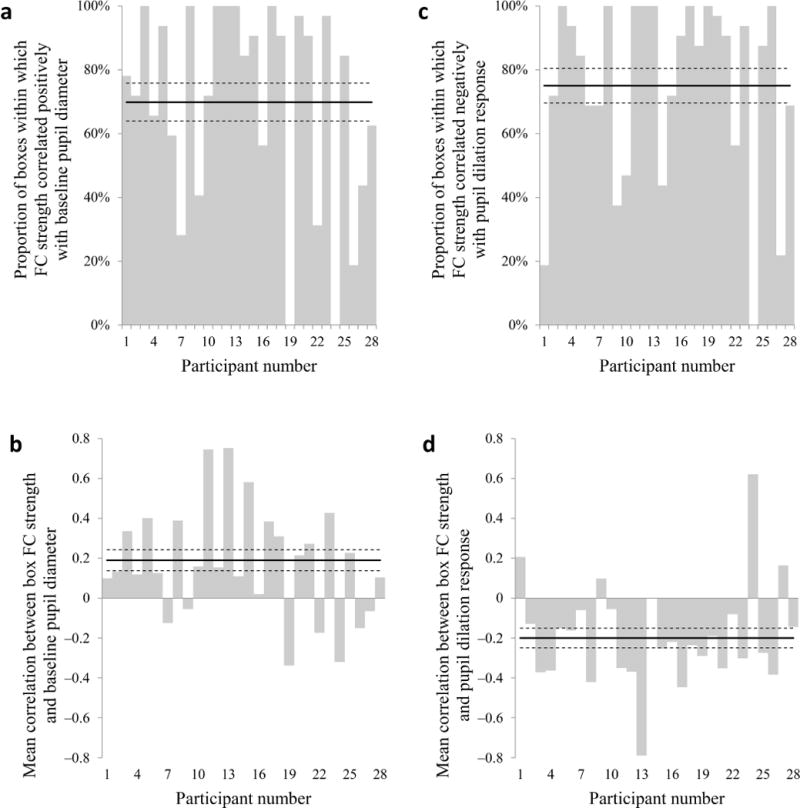
Pupil diameter and local functional connectivity. (a, c) Proportion of boxes within which mean functional connectivity strength was positively correlated with baseline pupil diameter (a) or negatively correlated with pupil dilation response (c) for each participant. (b, d) Mean correlation between within-box functional connectivity strength and baseline pupil diameter (b) or pupil dilation response (d) for each participant. Solid horizontal line: group means, dashed horizontal lines: s.e.m.