
Figure 8.
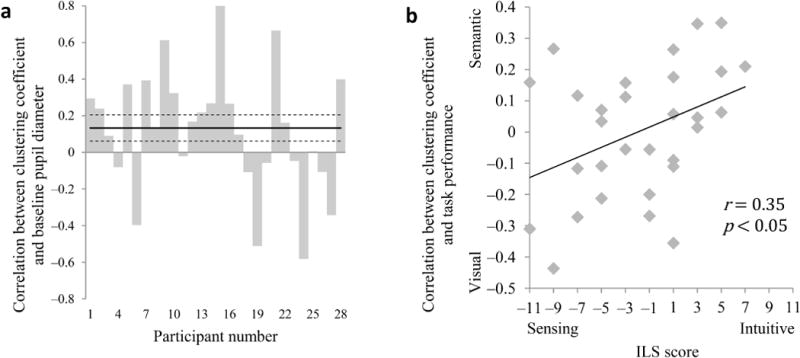
The clustering of functional connections, pupil diameter and task performance. (a) Game-by-game correlation between clustering coefficient and baseline pupil diameter by participant. n = 28. (b) Game-by-game correlation between clustering coefficient and visual-semantic performance difference in task as a function of sensing-intuitive score on the ILS questionnaire. n = 30.