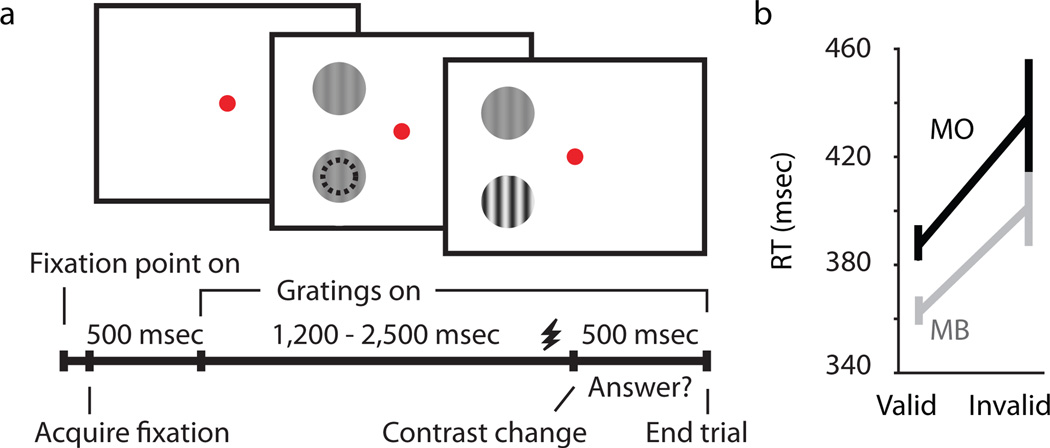
Figure 1.
Attention task and behavioral performance. (a) Illustration of the attention task including representative frames of the visual display for a validly cued trial where attention was directed by cue color toward the receptive field of the neuron. Dashed black circle represents the receptive field of the recorded neuron. The timeline for one trial is shown at bottom; LGN shock timing is indicated schematically just prior to the contrast change (shocks occured on 70% of trials). (b) Reaction time (RT) data for valid versus invalid trials for the two monkeys (Monkey B (MB), p=0.006); Monkey O (MO), p=0.046). Error bars represent SEMs.

