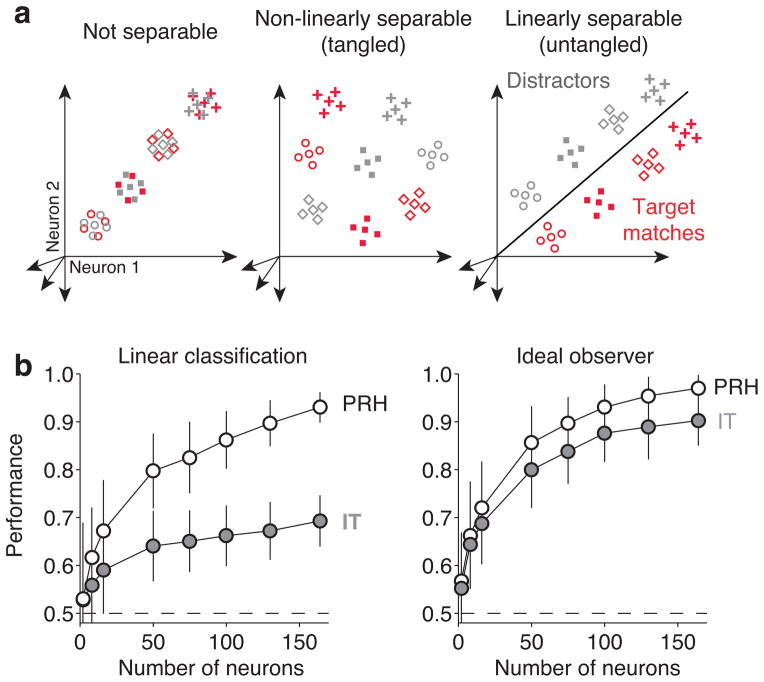
Figure 3. Population performance.
a) Each point depicts a hypothetical population response, consisting of a vector of the spike count responses to a single condition on a single trial. The four different shapes depict the hypothetical responses to the four different images and the two colors (red, gray) depict the hypothetical responses to target matches and distractors, respectively. For simplicity, only 4 of the 12 possible distractors are depicted. Clouds of points depict the predicted dispersion across repeated presentations of the same condition due to trial-by-trial variability. The target-switching task (Figure 2) requires discriminating the same objects presented as target matches and as distractors. b) Performance of the IT (gray) and PRH (white) populations, plotted as a function of the number of neurons included in each population, via cross-validated analyses designed to probe linear separability (left), and total separability (linear and/or nonlinear; right). The dashed line indicates chance performance. We measured linear separability with a cross-validated analysis that determined how well a linear decision boundary could separate target matches and distractors (see Text, Methods). We measured total separability with a cross-validated, ideal observer analysis (see Text, Methods). Error bars correspond to the standard error that can be attributed to the random assignment of training and testing trials in the cross-validation procedure and, for populations smaller than the full data set, to the random selection of neurons.

