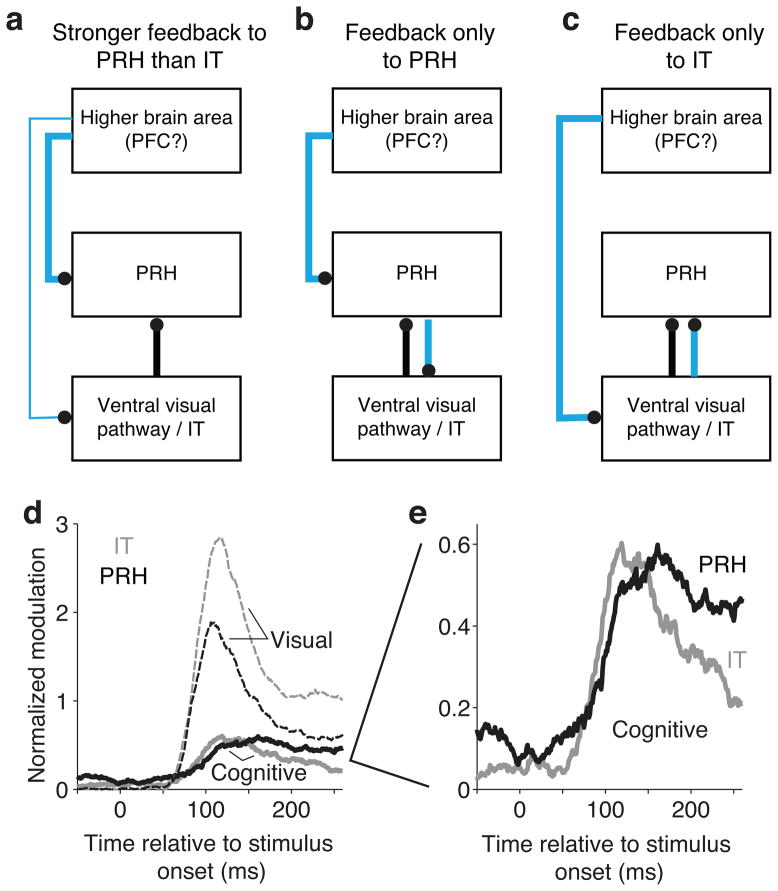
Figure 5. Discriminating between classes of models that predict more “untangled” target match information in PRH than IT.
a–c) Black lines indicate visual input; cyan lines indicate “cognitive input” that can take the form of working memory or target match information (see Text). d) Average magnitudes of visual (dashed) and cognitive (solid) normalized modulation plotted as a function of time relative to stimulus onset for IT (gray) and PRH (black). Normalized modulation was quantified as the bias-corrected ratio between signal variance and noise variance (see Methods, Equation 4), and provided a noise-corrected measure of the amount of neural response variability that could be attributed to: “visual” - changing the identity of the visual stimulus; “cognitive” - changing the identity of the sought target and/or nonlinear interactions between changes in the visual stimulus and the sought target. e) Enlarged view of the cognitive signals plotted in subpanel d. In panels d and e, response matrices were calculated from spikes in 60 ms bins with 1 ms shifts between bins.

