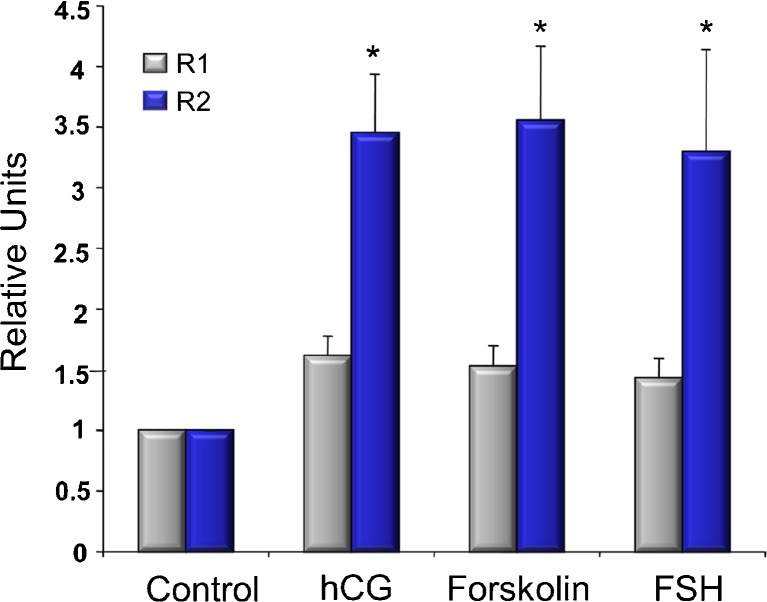
Fig. 1.
AdipoR1 (gray bars) and AdipoR2 (blue bars) mRNA expression in human granulosa cells cultured for 24 h with or without hCG (10 IU), Forskolin (10 uM) or FSH (10 IU). Experiment was repeated at least 7 times with different cell isolations. Bars represent average with SEM. * represents difference from control (p < 0.05)

