
Figure 1.
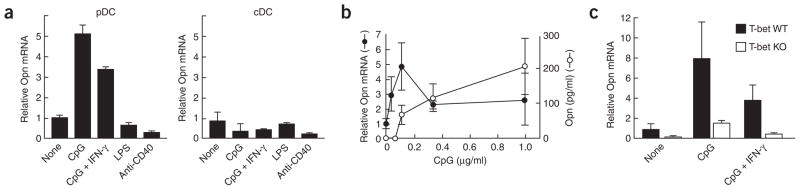
Opn expression in pDCs and cDCs 24 h after stimulation. (a) Opn mRNA in splenic pDCs (left) or cDCs (right) stimulated with 1 μg/ml of CpG-B (ODN-1668); 1 μg/ml of CpG-B plus 10 ng/ml of recombinant mouse IFN-γ protein; 1 μg/ml of lipopolysaccharide (LPS); or 5 μg/ml of anti-CD40. Relative Opn mRNA is based on Opn mRNA in pDCs without stimulation. (b) Opn mRNA and secreted protein in pDCs and culture supernatants, respectively. (c) Opn mRNA concentrations in T-bet wild-type (T-bet WT) and T-bet-deficient (T-bet KO) pDCs. Concentrations of CpG-B and recombinant mouse IFN-γ were 1 μg/ml and 10 ng/ml, respectively. Relative Opn mRNA is based on Opn mRNA in T-bet wild-type pDCs without stimulation. Opn mRNA and protein were measured by quantitative real-time PCR of cDNA and ELISA, respectively, with triplicate wells, and are presented with error bars. Data are representative of at least three independent experiments.