Fig. 3.
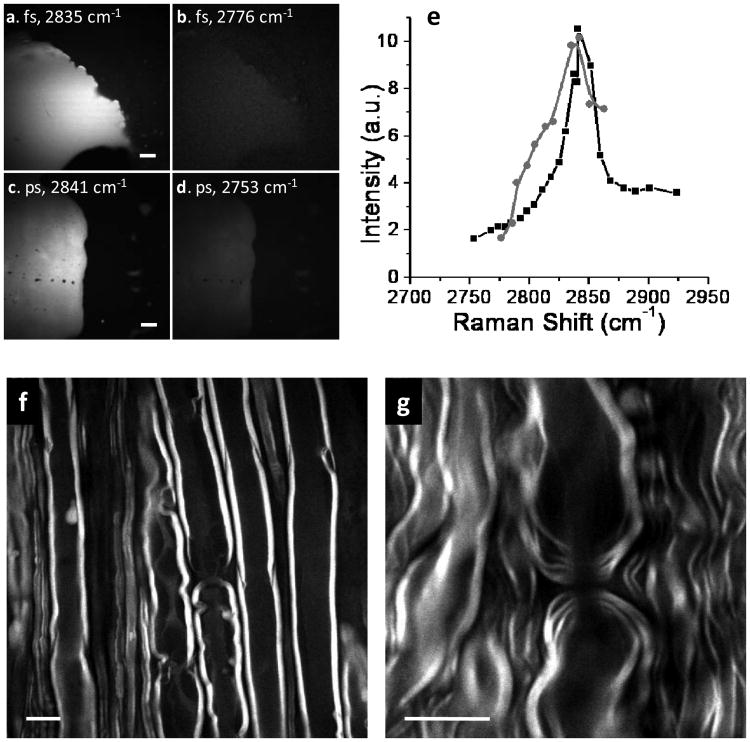
Vibrational contrast of C-H rich objects. (a-d) The forward-detected CARS images of a subcutaneous fat tissue by the fs (a-b) and ps (c-d) lasers, respectively. The Raman shift is marked in each image. Scale bars = 20 μm. (e) The CARS spectra of subcutaneous fat recorded with the fs (grey) and ps (black) lasers. (f-g) The backward-detected CARS images of myelin sheath surrounding parallel axons in a fresh spinal tissue (f) and paranodal myelin at a node of Ranvier (g). Scale bars = 10 μm.

