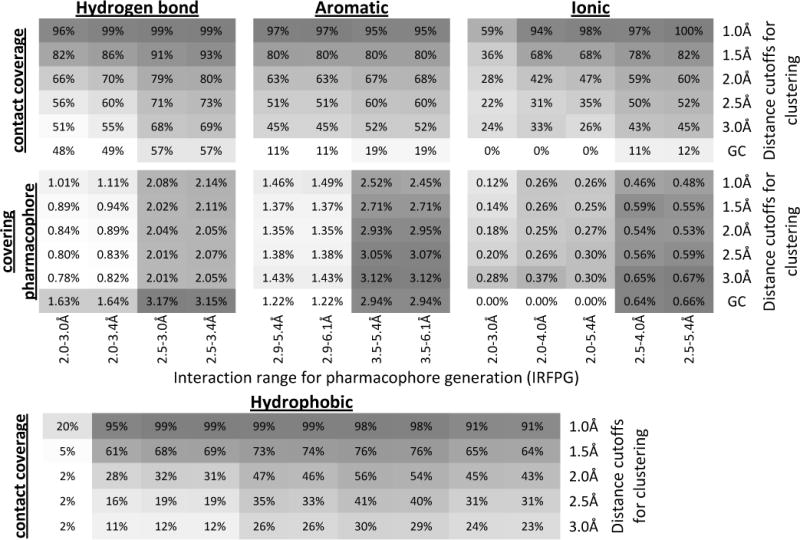
Figure 3.


Heat map of the overall contact coverage rate and percentage of the covering pharmacophore for hydrogen-bonding, aromatic, ionic and hydrophobic pharmacophores. For each pharmacophore type, the upper panel shows the overall contact coverage rate and the lower panel shows the percentage of the covering pharmacophores. The results in each column are from the same IRFPG whereas the results in each row are from the same distance cutoffs for clustering. GC: energy-weighted geometric center.
