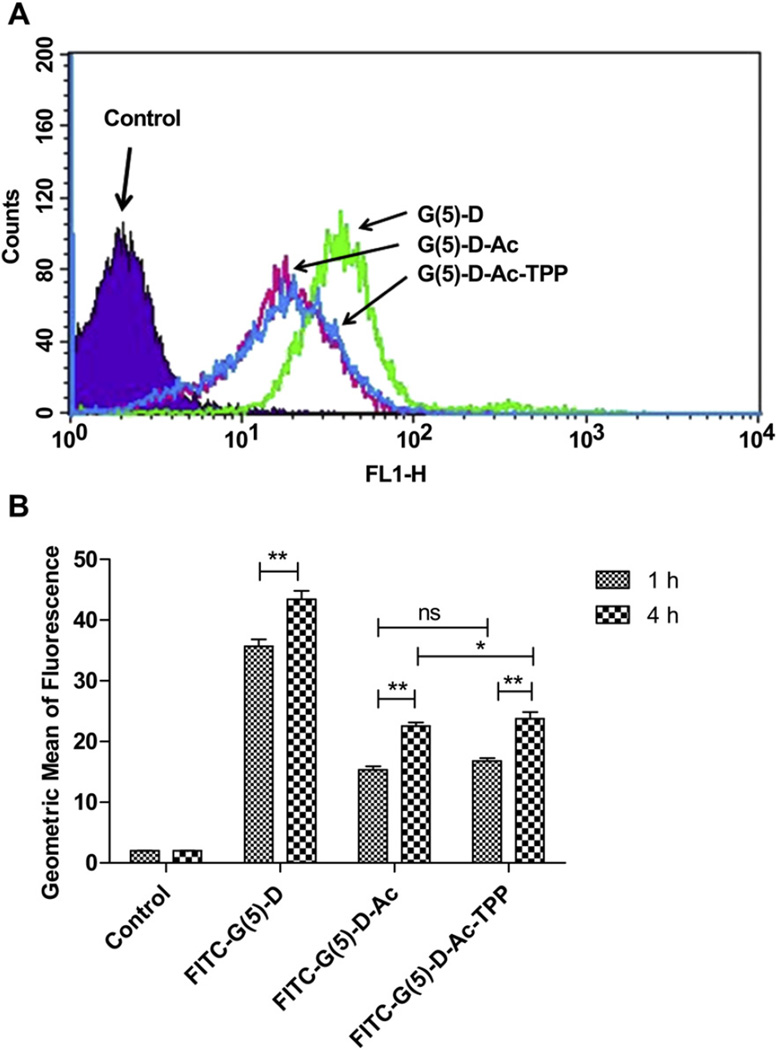
Fig. 2.
Cell-association of dendrimers by flow cytometric analysis. A. A representative histogram showing the change in FITC-fluorescence intensity of HeLa cells treated with FITC-labeled FITC-G(5)-D, FITC-G(5)-D-Ac and FITC-G(5)-D-Ac-TPP (0.5 µm) for 1 h compared to untreated cells (control). B. FITC-fluorescence intensities of cells treated with specified dendrimers at different incubation time (1 h and 4 h). Untreated cells were used as control for each corresponding incubation time. Data expressed as mean ± SD of three experiments carried out in triplicates (*p < 0.05 and **p < 0.001).

