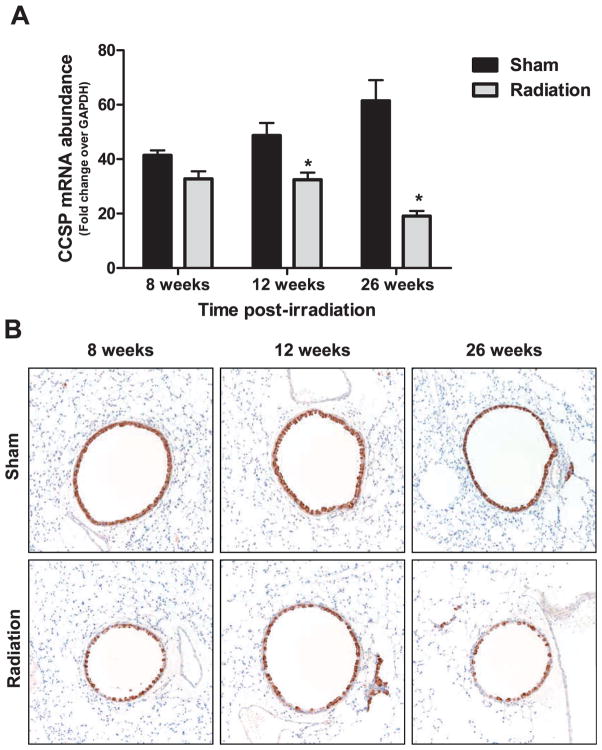
FIG. 5.
CCSP mRNA and CCSP protein expression in airway epithelial cells after irradiation alone. Panel A: CCSP mRNA abundance in the lungs at 8, 12 and 26 weeks after 15 Gy whole-lung irradiation. Abundance is expressed as fold change over GAPDH internal control. Data are expressed as mean ± SEM. Data were analyzed by two-way ANOVA with Fisher’s post-test (*P < 0.05 versus sham-infected, n =10 per group). Panel B: Representative images (20×) of CCSP-expressing cells in the airways (brown) of sham and irradiated animals at each time point.

