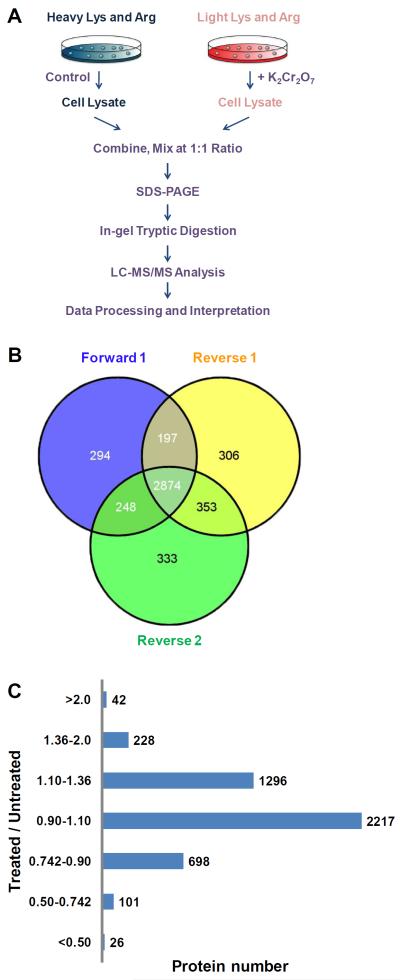
Figure 1.
An SILAC-based quantitative proteomics approach to reveal the potassium dichromate-induced perturbation of global protein expression. (A) A flowchart illustrating forward SILAC combined with LC-MS/MS for the comparative analysis of protein expression in GM00637 cells upon potassium dichromate treatment. (B) A summary of the number of proteins quantified from three independent SILAC experiments. (C) The distribution of expression ratios (treated/untreated) for proteins that were quantified in at least one set of SILAC experiment.

