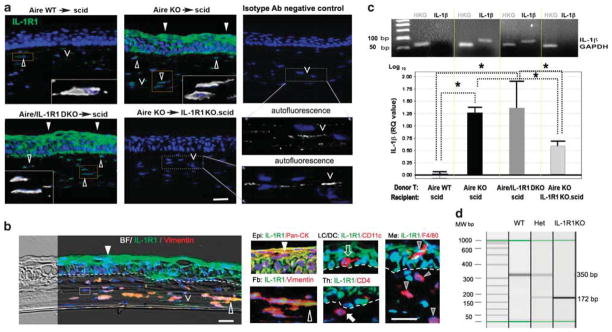
Figure 4.

Characterization and localization of IL-1 receptor type 1 (IL-1R1)-expressing cells in CD4+ T-cell-mediated squamous metaplasia (SQM). (a) Immunolocalization of IL-1R1-expressing cells (shown in green) in the corneas of adoptive transfer recipients. Nuclei were counterstained with 4′,6′-diamino-2-phenylindole (DAPI) (blue). Closed arrowheads denote IL-1R1-expressing cells in the epithelial compartment, while open arrowheads indicate IL-1R1-expressing cells in the stromal compartment. Boxed areas within each image are shown in high power insets with oversaturated Alexa 488 signal (shown in white color). Autofluorescence observed in IL-1R1 KO.scid recipients and isotype controls (denoted with carets ‘V’) are provided in high-power subfigures in the right bottom panel of (a). Autofluorescence appears as linear, nonspecific staining associated with collagen lamella that is distinctly different from IL-1R1+ cells in the stroma (open arrowheads) that are fusiform in shape and possess a cell nucleus. Bar = 50 μm. Pictures are representative of 5 mice per group. (b) Dual-labeling of IL-1R1 (green) with cell type-specific markers (red) to profile cells populating the SQM microenvironment. In the left panel, a bright-filed (BF) image is merged with an immunofluorescent picture to provide an overview of IL-1R1+ and IL-1R1−cells in the SQM cornea. In the right panel, high-powered micrographs show distinct cell types constituting the mixed-cell population. Markers for tissue structure cells included vimentin (open arrowhead) for stromal fibroblasts (Fb) and pan-cytokeratin (pan-CK, closed arrowhead) for epithelial (Epi) cells. Immune cell markers included CD4 (closed arrow) and F4/80 (gray arrowhead) for infiltrating T cells and macrophages (MØ), respectively. CD11c (open arrow) was used to identify resident antigen-presenting cells (APCs), including epithelial Langerhan’s cells (LC), stromal dendritic cells (DCs) and infiltrating APCs. Yellow signal indicates colocalization of IL-1R1 with cell-specific marker, while red signal indicates that a given cell type does not express IL-1R1. Dotted line indicates epithelial basement membrane. Boxed areas above and below the dotted line (left panel) represent IL-1R1− immune cells phenotypically characterized in the high-power subfigures (right panel). Nuclei stained blue with DAPI. Scale bar =50 μm. (c) Upper panel shows confirmation of IL-1β transcript expression by traditional semiquantitative polymerase chain reaction (PCR). Gel image was obtained following electrophoresis of PCR products amplified from equivalent amounts of cDNA for 22 cycles. Expected molecular weight of IL-1β amplicons and glyceraldehyde 3-phosphate dehydrogenase (GAPDH) amplicons are 90 and 70 bp, respectively. The lower panel shows TaqMan quantitative PCR analysis of IL-1β transcripts in the corneolimbal epithelium. The control group, Aire WT→scid, was used as the reference (designated 1-fold) to generate relative quantitation (RQ) values of GAPDH-normalized IL-1β expression for the other three adoptive transfer groups. Data are shown as mean RQ value±s.d. (in log10 unit, where the baseline 1-fold = 0). Statistically significant differences between groups, P<0.05, are indicated by dotted lines with overlying asterisk. (d) Genotyping image of IL-1R1 in scid recipients with or without IL-1R1. Using specific primers targeting the mutated gene loci, three genotypes of scid mice are easily discernable by a 172 and 350 bp bands in the electrophoresis image of PCR products. IL-1R1 WTs (IL-1R1+/+) uniformly expresses a 350 bp band, IL-1R1 knockouts (IL-1R1−/−) uniformly expresses a 172 bp band, while IL-1R1 heterozygotes (IL-1R+/−) have both bands. Aire WT, autoimmune regulator wild type; scid, severe-combined immunodeficiency.
