
Figure 4.
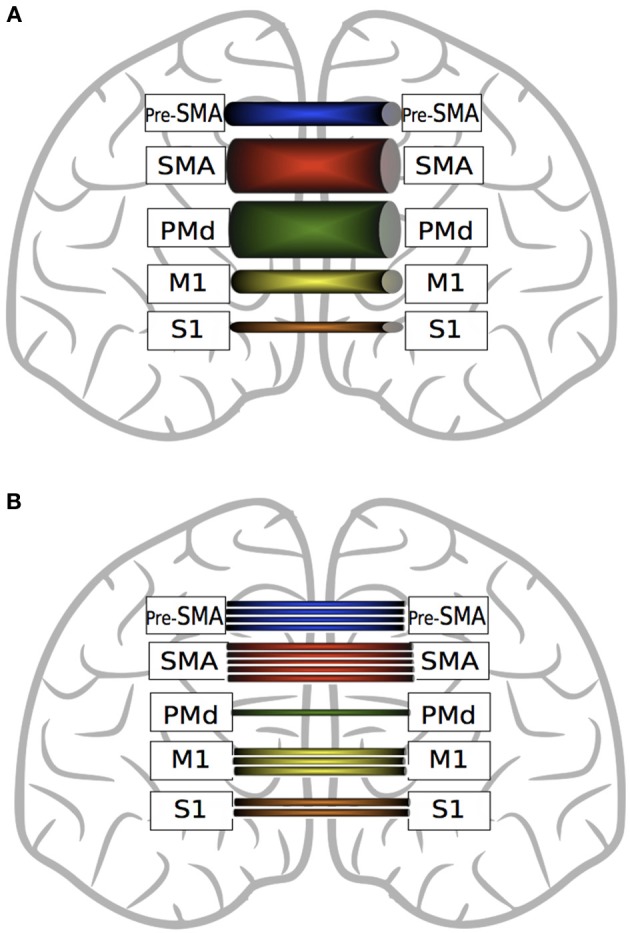
A graphic depiction of the findings of Fling et al. (2011). Panel (A) represents fractional anisotropy (FA) of transcallosal fibers connecting homologous motor regions. Thicker tubes indicate higher FA values. SMA fibers exhibit greater FA values than pre-SMA, M1 and S1. Transcallosal PMd fiber FA values are greater than those connecting pre-SMA, M1 and S1. Fibers connecting homologous M1 and homologous pre-SMA exhibit higher FA values than S1 fibers. Panel (B) represents the quantity of interhemispheric fiber tracts connecting homologous motor regions. There are more fiber tracts connecting homologous SMA regions than M1, PMd and pre-SMA. There are more fibers connecting pre-SMA than M1, S1 or PMd. Transcallosal M1 fibers are more numerous than those connecting S1 or PMd. (See text for details).