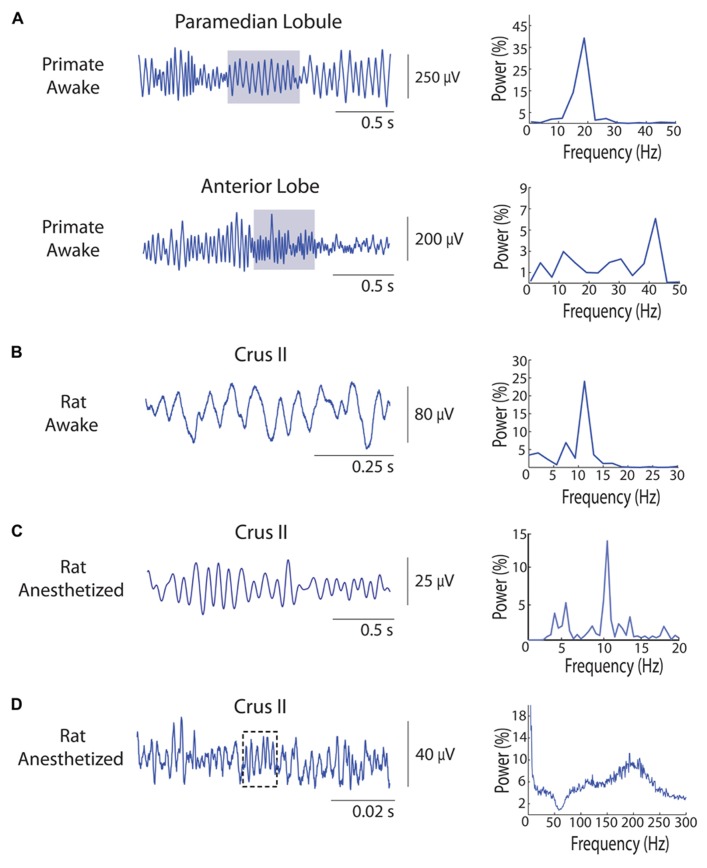
FIGURE 1.
A sample of oscillations recorded from cerebellar cortex in vivo local field potentials (LFPs) using metal microelectrodes. LFP example data located on the left, and corresponding Fast Fourier Transform (FFT) spectrum on the right. FFT shown in the form of %. (A) Simultaneous different types of LFP oscillations in the primate rhesus monkey cerebellum. Top: LFP oscillations from the PM GCL, around 19 Hz. Bottom: faster LFP oscillations recorded in the anterior lobe GCL, going up to 40 Hz. Gray shaded area corresponds to the time period for the FFT analysis. Notice the simultaneous co-existence of two different oscillatory phenomena. (B) Recording of LFP oscillations in the awake rat cerebellar cortex GCL. In this sample, the signal oscillates around 10.5 Hz, FFT on the whole trace. (C) Recording of LFP oscillations in the urethane-anesthetized rat cerebellar cortex GCL. Oscillations are here around the same frequency, at 11 Hz, FFT on the whole trace. (D) Recording of fast LFP oscillations in the urethane-anesthetized rat cerebellar cortex, using differential metal microelectrodes separated by 500 μm, with at least one tip located approximately in the Purkinje cell layer. A 312 Hz short 6-cycle episode is highlighted. FFT averaged on 120 2-s windows, so for the whole 2 min.

