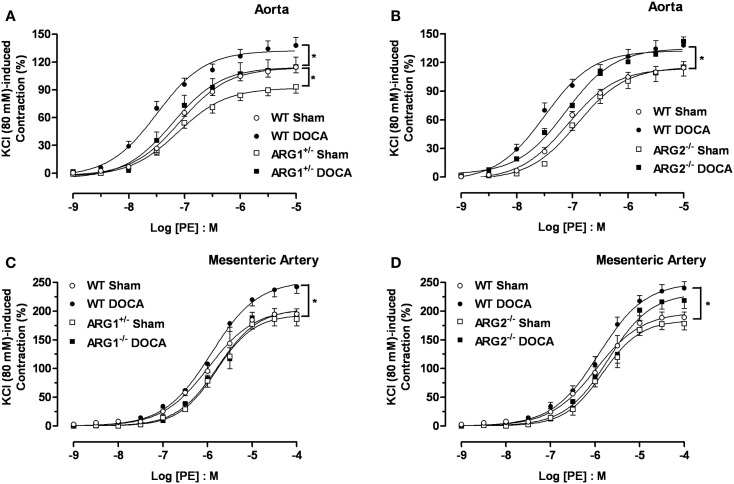
Figure 3.
Differences in contractile responses induced by phenylephrine (PE) in DOCA-salt treated arginase knockout (KO) mice. Concentration-response curves to PE (0.001–10 μM) in WT uninephrectomized (WT Sham), WT uninephrectomized and DOCA-salt treated (WT DOCA), partial arginase 1 (ARG1+/−) KO uninephrectomized (ARG1+/− Sham), ARG1+/− and DOCA-salt treated (ARG1+/− DOCA), arginase 2 (ARG2−/−) uninephrectomized (ARG2−/− Sham) and ARG2−/− DOCA-salt treated mice in aorta (A,B), and mesenteric artery [MA; (C,D)]. Experimental values were calculated relative to the maximal changes from the contraction produced by KCl (80 mM), which was taken as 100%. Data represents mean ± SEM of five experiments. *P < 0.05, compared with WT Sham group.

