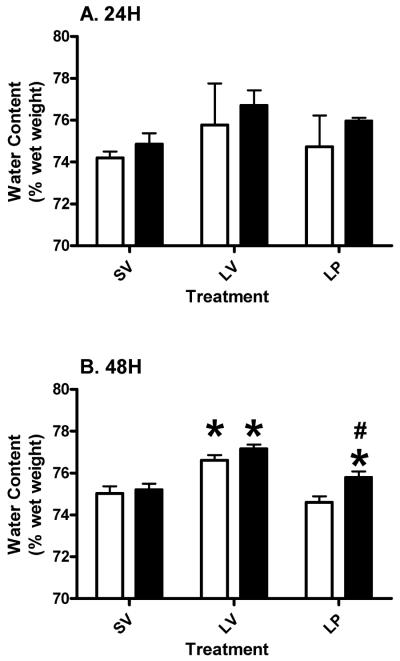
Figure 2.
Thalamic edema at 24 (A) and 48 (B) hours post-TBI in young and aged Ovx rats. Two-way ANOVA results are represented as mean ± SEM. Asterisk (*) indicates significant difference between treatment within the same age group. Pound (#) denotes significant difference between young and aged subjects within the same treatment. Clear bars represent young, and gray bars represent aged groups.

