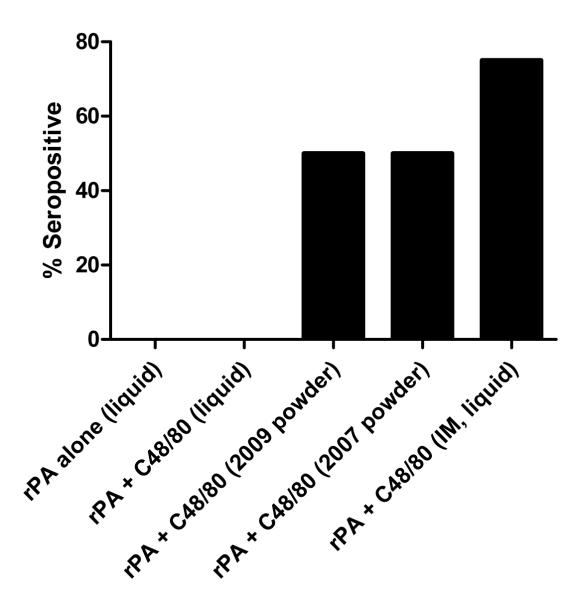
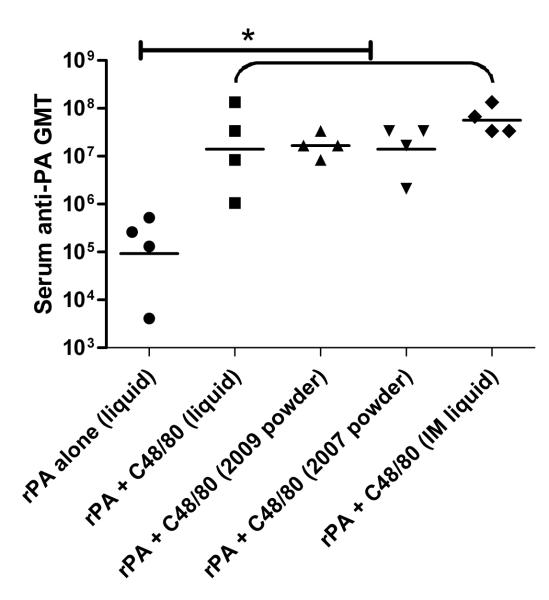
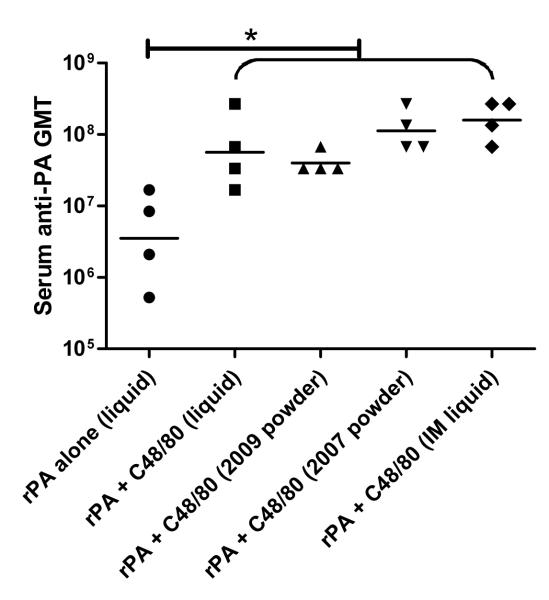
Figure 11.
Animal study serum ELISA results.
(A) day 7 seropositive results. (B) day 35 serum anti-rPA IgG GMT titers. (C) day 56 serum anti-rPA IgG GMT titers. A one-way ANOVA followed by Tukey’s post test were performed on log2 transformed ELISA titer. A statistical significance was revealed between the adjuvanted groups and rPA alone group. (n=4, *, P < 0.05). Data are presented as ELISA titers with geometric mean.


