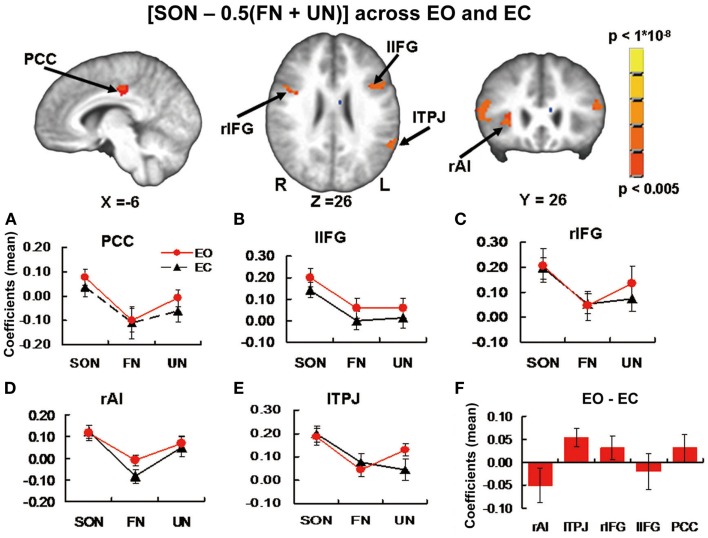
Figure 2.
Brain images and panels (A–E) from Experiment 1 additional exploratory part. Activation Clusters in the contrast [SON −0.5 (FN + UN)] across EO and EC baselines. Panels show estimated coefficients (mean across region ± SE) for name conditions relative to baselines in each region. No significant differences were found when comparing stimulus-induced activity between baselines. (F) From Experiment 2. Estimated coefficients (mean across region ± SE) for the contrast [EO – EC] in the same ROI’s. Again no significant differences were found. PCC, posterior cingulate cortex; r/lIFG, right/left inferior frontal gyrus; rAI, right anterior insula; lTPJ, left temporoparietal junction.

