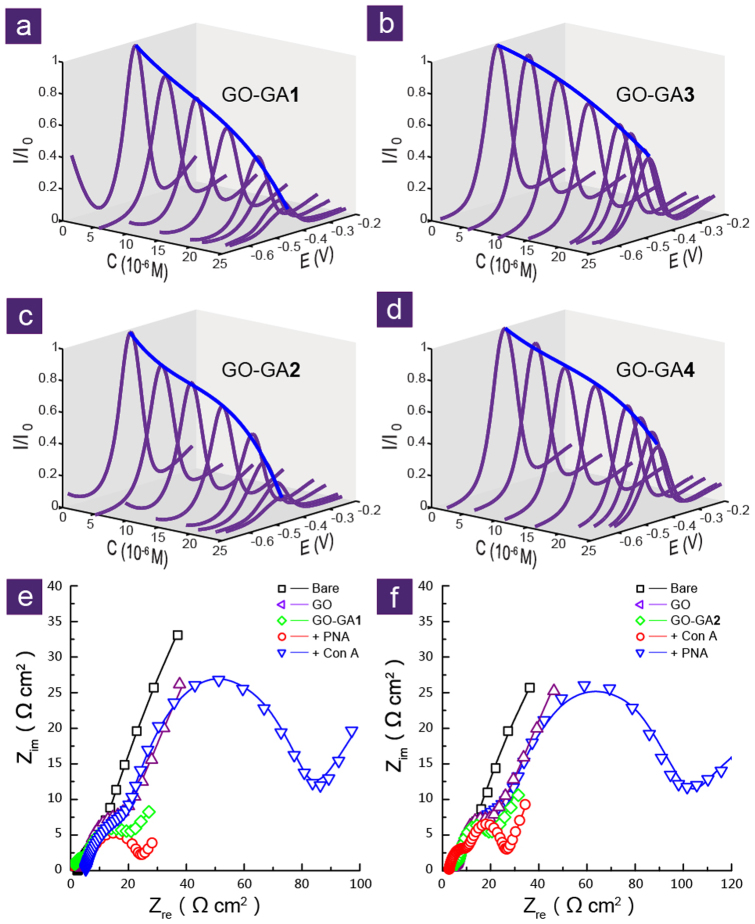
Figure 4. Probing the specific sugar-lectin interactions with the biomimetic interfaces by DPV and/or electrochemical impedance spectroscopy (EIS).
DPVs of SPEs confined with (a) GO-GA1, (b) GO-GA3, (c) GO-GA2 and (d) GO-GA4 in the absence (the top curves) and presence of incremental specific lectins (where I is the changed current after addition of the lectin and I0 the initial current). For detailed titration data, see Table S1. Experimental (hollow plots) and fitted (lines) Nyquist plots of SPEs in the absence (bare) and presence of (e) GO, GO-GA1, GO-GA1+PNA, and GO-GA1+Con A; (f) GO, GO-GA2, GO-GA2+PNA and GO-GA2+Con A. For circuit models used to fit these Nyquist plots, see Fig. S8. All experiments were performed in Tris-HCl (pH 7.0).

